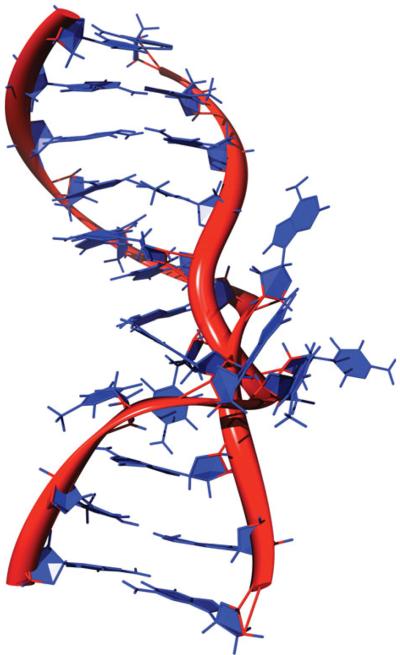
Fig. 7.
The structure of a P-DNA region as determined by MD simulations. The DNA structure shown in Fig. 6 was rendered as a cartoon view with periodic boundary conditions translated to the center of the cartoon view to facilitate visualization of the P-DNA. The path of the DNA backbone is rendered as a red ribbon, bases are in blue.

