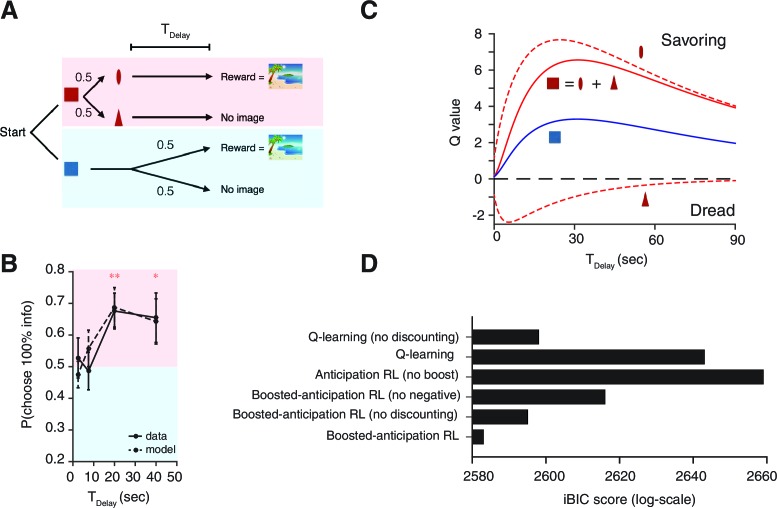
Figure 4. Human decision-making Experiment-1.
(A) On each trial, subjects chose either of two colored targets (Red or Blue in this example). Given Red, cue (oval) or (triangle) was presented, each with probability ; was followed by a reward (an erotic picture) after time , while was not followed by reward. Given Blue, either a reward or nothing followed after the fixed time delay with probability each. (B) Results. Human participants (n=14) showed a significant modulation of choice over delay conditions [one-way ANOVA, F(3,52)=3.09, p=0.035]. They showed a significant preference for the 100% info target (Red) for the case of long delays [20 s: , , 40 s: , ]. The mean +/- SEM indicated by the solid line. The dotted line shows simulated data using the fitted parameters. (C) Mean Q-values of targets and predicting cues estimated by the model. The value of informative cue is the mean of the reward predictive cue (oval), which has an inverted U-shape due to positive anticipation, and the no-reward predictive cue (triangle), which has the opposite U-shape due to negative anticipation. The positive anticipation peaks at around 25 s, which is consistent with animal studies shown in Figure 3(B,C). See Table 2 for the estimated model parameters. (D) Model comparison based on integrated Bayesian Information Criterion (iBIC) scores. The lower the score, the more favorable the model. Our model of RPE-boosted anticipation with a negative value for no-outcome enjoys significantly better score than the one without a negative value, the one without RPE-boosting, the one without temporal discounting, or other conventional Q-learning models with or without discounting.
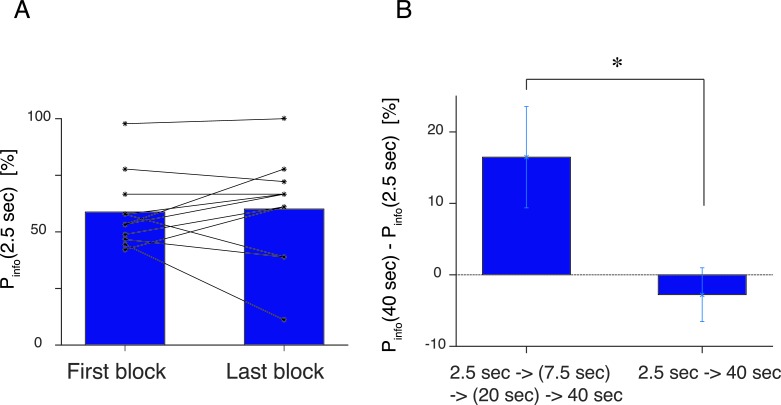
Figure 4—figure supplement 1. (A) Control experiment, where the first block and the last (5th) block of the experiment had the same delay duration of s.
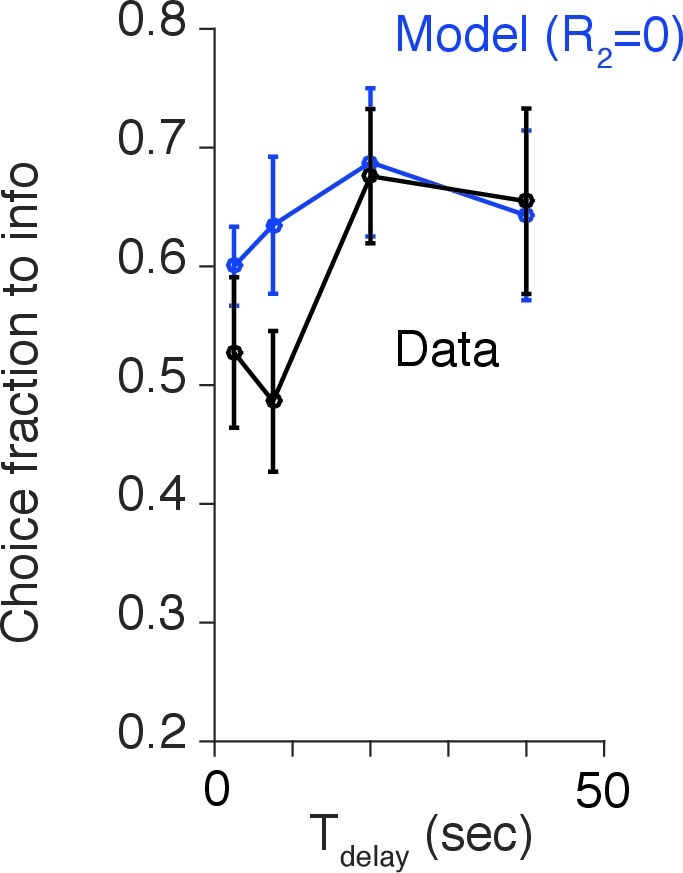
Figure 4—figure supplement 2. The generated choice by the model without the negative value assigned to the no-reward outcome.


