
Figure 4.
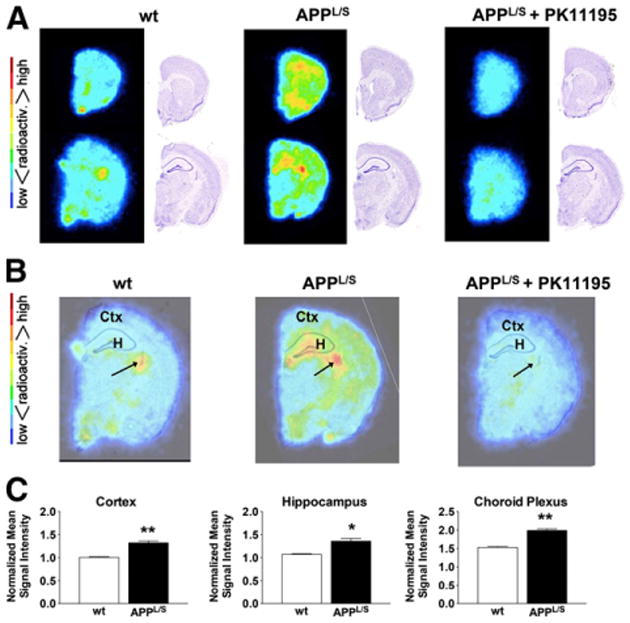
Ex vivo autoradiography of 15- to 16-mo-old mice. (A) Representative images and Nissl staining of same brain sections. (B) Overlay of autoradiography brain images with Nissl staining. (C) Mean signal intensity for specific brain regions normalized to striatum for wt and APPL/S mice (n = 4/group). Arrows indicate choroid plexus. *P = 0.05. **P value < 0.005. Ctx = cortex; H = hippocampus.