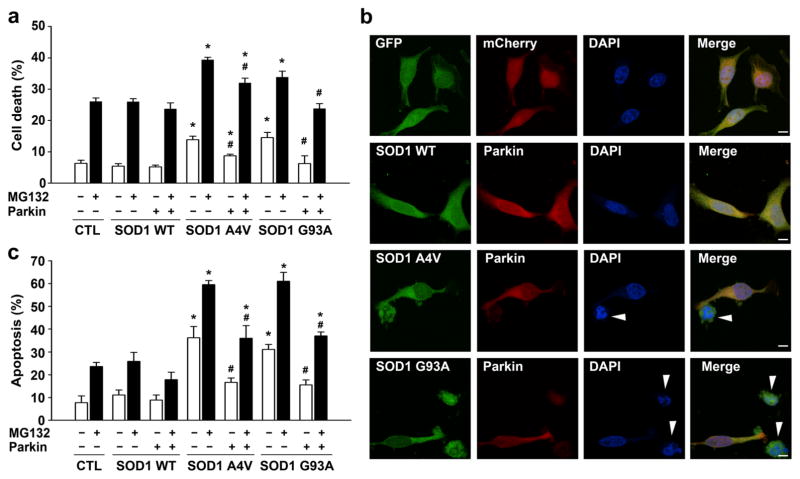
Fig. 1.
Parkin confers cytoprotection against mutant SOD1-induced toxicity. a SH-SY5Y cells expressing Myc vector control (CTL), Myc-tagged SOD1 WT, or mutants and GFP-tagged parkin or GFP were incubated in the absence or presence of 20 μM MG132 for 24 h. The extent of cell death was determined by measuring the amount of LDH released in the culture media and normalized to the total amount of LDH upon cell lysis. Data represent mean±SEM from three independent experiments. *P<0.05 versus the corresponding Myc vector control or SOD1 WT-expressing cells; #P<0.05 versus the corresponding control cells lacking exogenous parkin, two-way ANOVA with Tukey’s post hoc test. b, c SH-SY5Y cells co-transfected with mCherry or mCherry-tagged parkin and GFP or GFP-tagged SOD1 WT or mutants were incubated in the absence or presence of 20 μM MG132 for 24 h. Fluorescence images (b) show transfected cells identified by GFP (green) and mCherry (red) fluorescence, and nuclear integrity assessed by DAPI staining (blue) under normal culture conditions. Apoptotic nuclei are denoted with arrowheads. Scale bar=10 μm. The bar graph (c) shows the extent of apoptosis as the percentage of GFP control (CTL), SOD1 WT, or SOD1 mutant-transfected cells with apoptotic nuclear morphology. Data represent mean±SEM from three independent experiments. *P<0.05 versus the corresponding GFP control or SOD1 WT-expressing cells; #P<0.05 versus the corresponding mCherry control cells lacking exogenous parkin, two-way ANOVA with Tukey’s post hoc test

