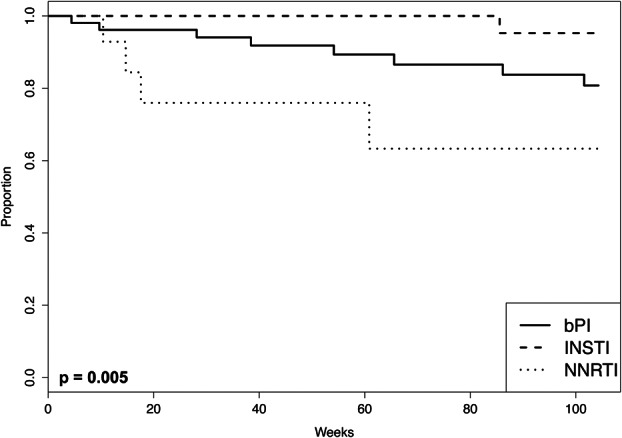
FIGURE 1.

The Kaplan–Meier plot shows the cumulative incidence of patients free of failure events per the as-treated analysis according to the anchor-drug class. The as-treated analysis failure outcome was VF, defined as not reaching an undetectable HIV-1 RNA level by 24 weeks, virological rebound, and regimen switching during viremia. The P value was calculated by the log-rank test.
