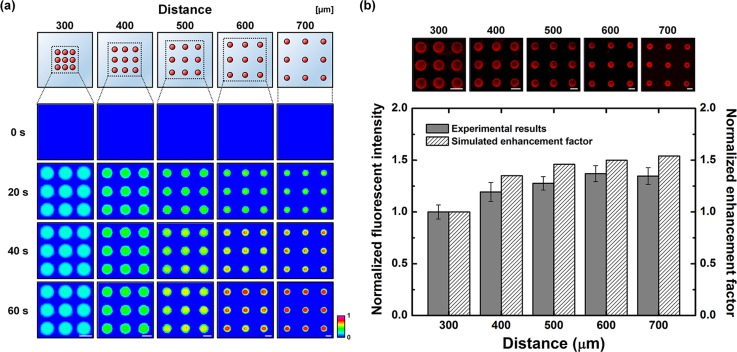
FIG. 4.
Effect of distance between the assay spots of a microarray on optoelectrofluidic immunoreaction. (a) Simulation results of the temporal distribution change of antibody–analyte complexes under an applied AC voltage of 15 Vpp at 10 kHz with different distance conditions. (b) Fluorescence immunoreaction results and simulated enhancement factors. The simulated enhancement factor indicates the ratio of initial slope of temporal immunoreaction results compared to the passive mode. The results were normalized by the value from the distance condition of 300 μm (scale bar: 200 μm, n = 9).

