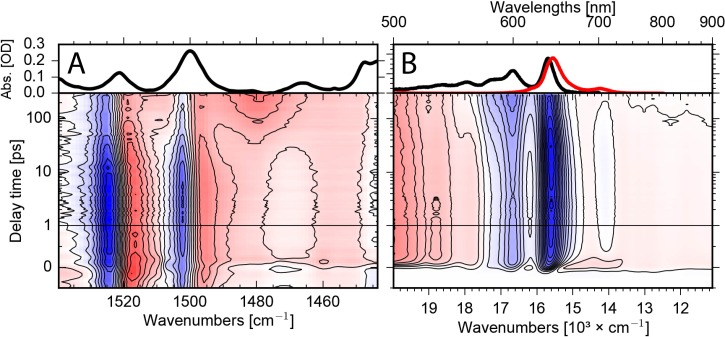
FIG. 2.
A. Upper panel: Infrared absorption spectrum of Al(tpfc-Br8)(py)2 in the investigated spectral region. Lower panel: 2D map of the vibrational absorbance change upon excitation at ∼400 nm as a function of wavenumber and delay time. Negative signals (blue) indicate bleaching signals, while positive signals (red) are due to singlet excited state absorption and triplet absorption. B. Upper panel: Visible absorption spectrum of Al(tpfc-Br8)(py)2 (black line) and fluorescence signal (red line) in the investigated spectral region. Lower panel: 2D map of the absorbance change as a function of wavelengths and pump-probe delay time. Excitation at the same wavelength ∼400 nm. Positive signals (red) show excited state and triplet absorption; negative signals (blue) indicate bleaching and stimulated emission signals. The transient changes of both experiments can be compared directly.

