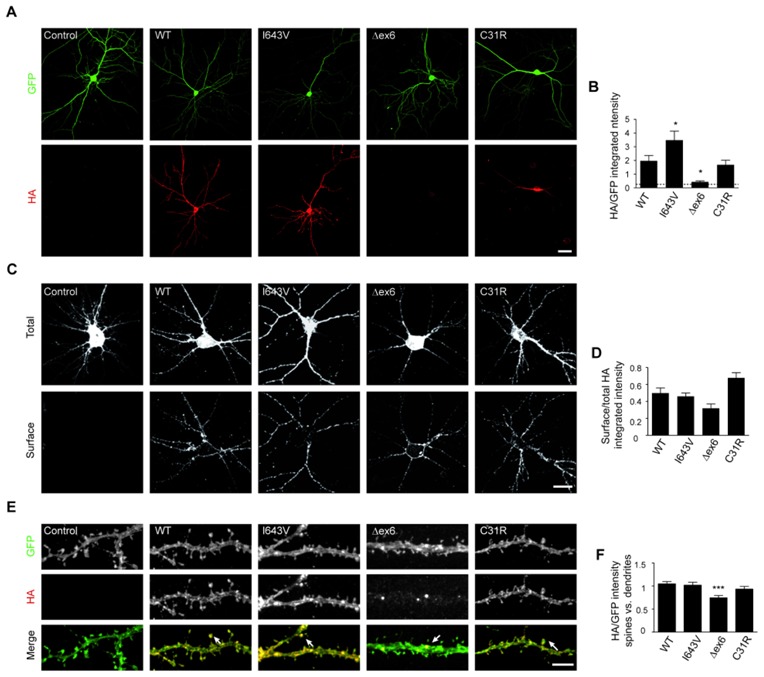
Figure 2. Protein expression and localization of Δex6 and C31R IL1RAPL1 mutants.

(A) Protein detection by immunofluorescence in mouse hippocampal neurons co-transfected with different HA-IL1RAPL1 constructs and GFP. IL1RAPL1 proteins were revealed by an anti-HA tag antibody, and signal was normalized to GFP expression (scale bar 20 μm). (B) Bar graphs show the mean + SEM of HA-IL1RAPL1 to GFP expression ratio (at least 35 neurons per each condition from 3 independent experiments, *p <0.01 compared to WT). (C) Total (top panel) and surface (bottom panel) staining of HA-IL1RAPL1 proteins in mature hippocampal neurons using an anti-HA tag antibody (scale bar 20 μm). The ratio of integrated intensity of surface HA signal per total HA signal was measured for each neuron, and the mean + SEM is shown in (D). (E) Localization of total IL1RAPL1 within dendrites at DIV 18 in hippocampal neurons co-transfected with GFP (green) and the different HA-IL1RAPL1 constructs (red). Arrows in merge images show IL1RAPL1 localization to spines, or forming puncta on dendritic shafts when Δex6 is expressed (scale bar 5 μm). (F) Bars show the mean + SEM of the ratio of HA/GFP integrated density in spines and the HA/GFP integrated density in dendritic shafts (*** p <0.001 compared to WT protein).
