
Figure 5.
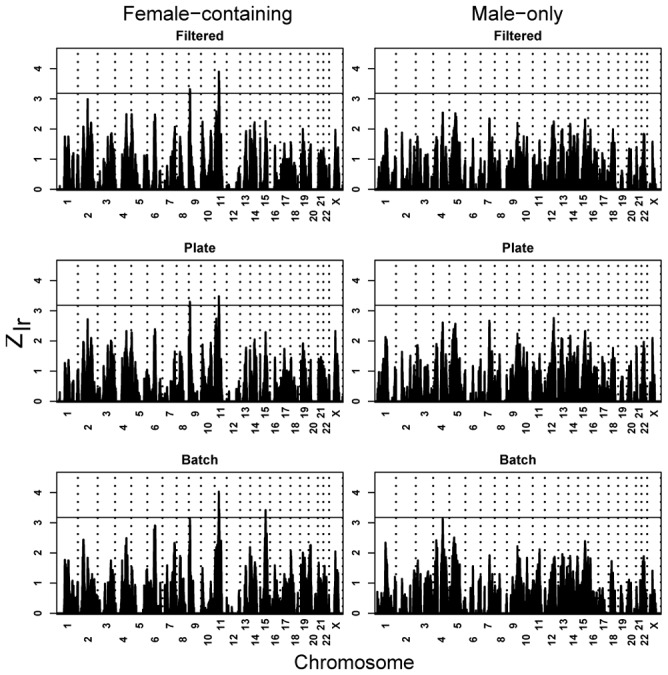
The effect on linkage of splitting families into FC and MO families while also removing families in which affected individuals putatively carry CNV. For FC families and filtered subset, peaks localize to 9p24.1 (Zlr = 3.32 at rs1575284; m-p = 0.105), and 11p12 (Zlr = 3.90 at rs1039205; m-p = 0.411); for FC/Plate, to 9p24.1 (Zlr = 3.28 at rs1821892; m-p = 0.295) and 11p12 (Zlr = 3.48 at rs1039205; m-p = 0.111); and for FC/Batch, to 11p13 (Zlr = 4.03 at rs1358054; m-p = 0.014) and 15q23 (Zlr = 3.30 at rs1433452; m-p = 0.044).