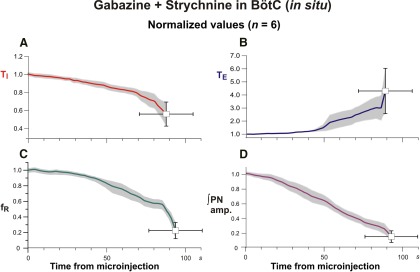
Figure 9.
Group data (n = 6) summarizing perturbations of respiratory rhythm and motor output pattern parameters by disrupting GABAAergic and glycinergic inhibition in the BötC of in situ perfused brainstem–spinal cord preparations. Solid colored curves in these time series are mean time and normalized parameter values and gray bands are ±1 SEM for the normalized values of TI (A), TE (B), respiratory frequency (fR; C), and integrated inspiratory activity amplitude (D) computed from the start of microinjections from recordings of integrated PN activity.

