
Figure 3.
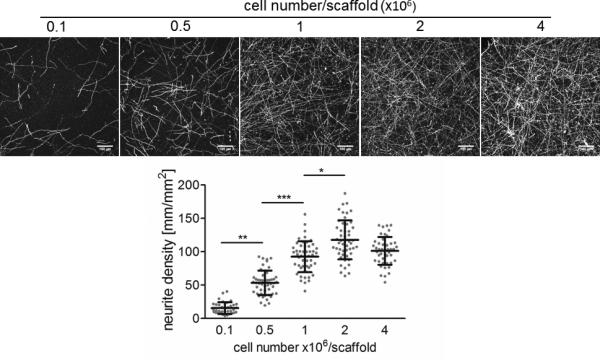
Neurite density in relation to the number of seeded cells. Constructs were immunostained after 1 week of culture with anti-TUJ1 antibody fluorescently labeled with Alexa-488. Images were acquired with confocal microscope (Leica SP2) over the depth of 200 μm, overlayed using maximum intensity and quantified using ImageJ software (NIH). Sale bar 100 μm. Statistical analysis was performed with ANOVA test with Dunn's multiple comparison post-test using GraphPad InStat 3 software (GraphPad): *** P<0.001, ** P<0.01, * P<0.05. 0.1 vs. 0.5: **P<0.01; 0.1 vs. 1:***P<0.001; 0.1 vs. 2:***P<0.001; 0.1 vs. 4:***P<0.001; 0.5 vs. 1:***P<0.001; 0.5 vs. 2:***P<0.001; 0.5 vs. 4:***P<0.001; 1 vs. 2:*P<0.05; 1 vs. 4:ns P>0.05; 2 vs. 4:ns P>0.05. Data shown as individual data points with means ±SD, n=43-50.