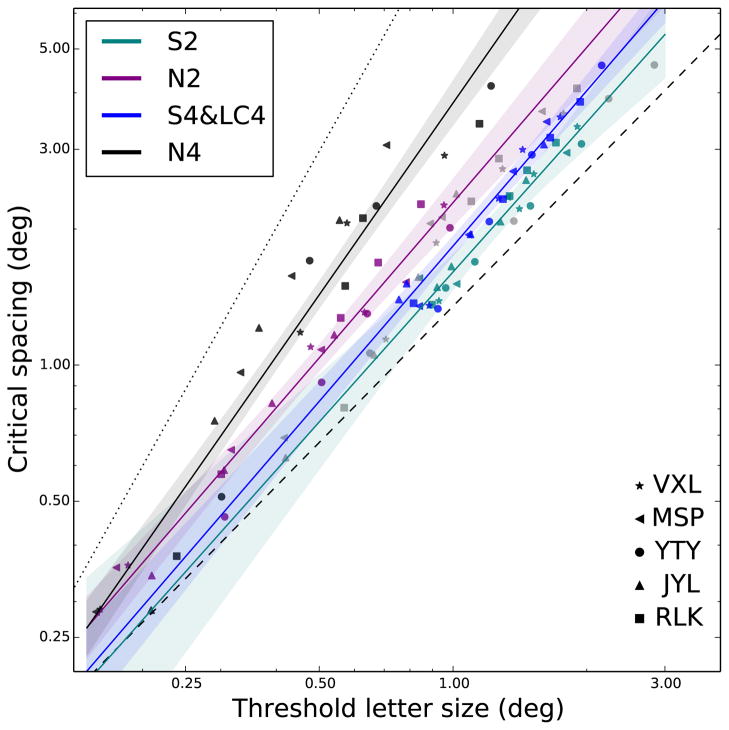
Figure 10.
Critical spacings are plotted as a function of threshold letter sizes. Data are replotted from Figure 9. Data from the five subjects are pooled, and different conditions are fit with colored lines as described in the text. Shaded regions around each line represent 95% confidence intervals estimated from linear fits. The dashed and dotted lines represent results from previous studies using blurred stimuli presented at the fovea (dashed line, representing acuity-limitation), or high-contrast stimuli presented in the normal periphery (dotted line, representing crowding-limitation).

