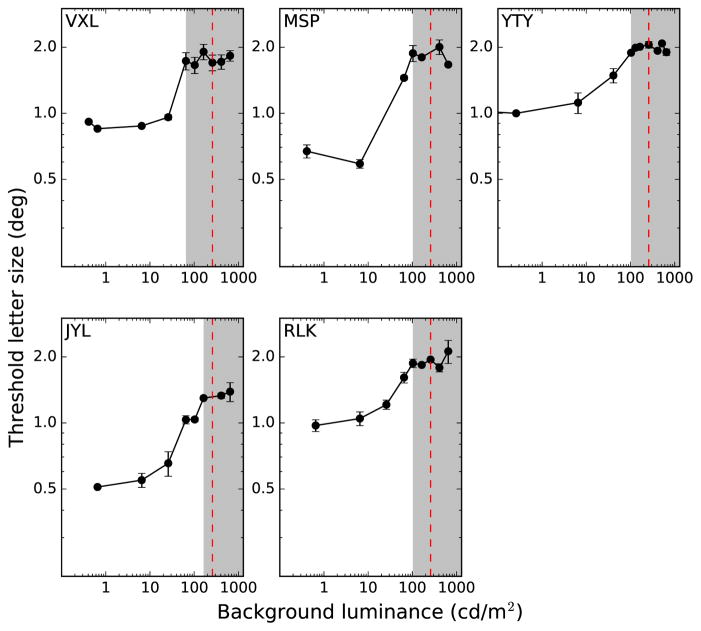
Figure 3.
Threshold letter size for identifying the orientation of a single blue Tumbling E is plotted as a function of the luminance of the yellow background. Results show the average and standard deviation of two staircases. Vertical red dashed lines indicate the luminance of the yellow adapting background used in the main experiment. Gray regions indicate S-cone isolation regimes, determined by the location of the plateaus.

