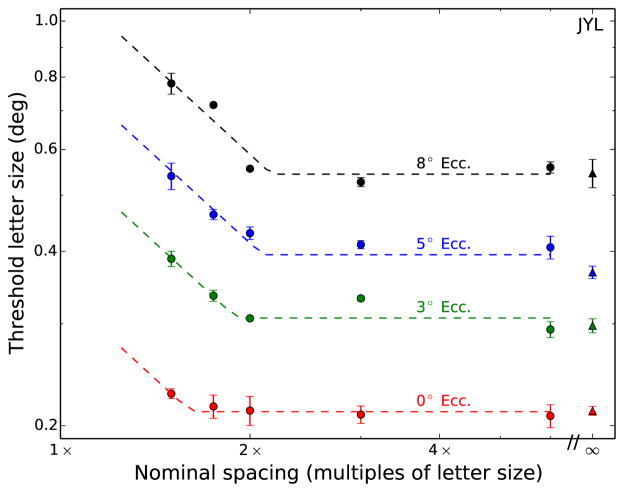
Figure 4.
Representative results of threshold letter size as a function of nominal spacing are plotted for all eccentricities for one stimulus condition (N2) and one subject. Data points indicate the mean threshold of two (or more) staircases, and error bars represent the standard deviation. Dashed lines indicate constrained two-line fits (see text for details). The infinity symbol denotes the no-flanker condition.

