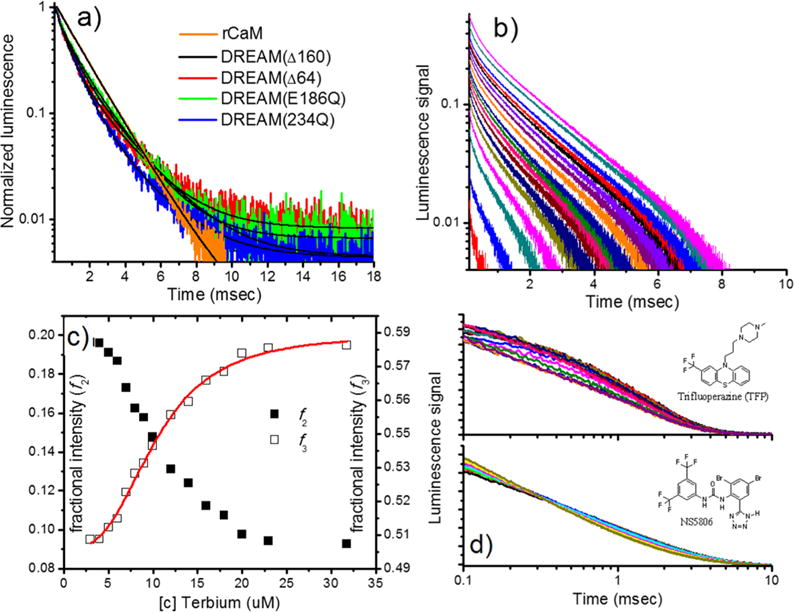
Figure 6.

(a) Luminescence decay of Tb3+ bound to CaM and constructs of DREAM, with 4:1 Tb3+:CaM and 2:1 Tb3+:DREAM stoichiometric ratios. Solid lines represent the best fit using Globals software analysis, and recovered parameters listed in Table 3. (b) Luminescence intensity decay profiles as a function of Tb3+ binding to 10 μM DREAM(Δ64). The luminescence decays in panel b were analyzed using a triple discrete model, and the fractional intensity contribution of the two slowest lifetimes is shown in c. The fastest decay component had a lifetime of ~80 μs with a <10% contribution and is not shown. (d) Luminescence decay of Tb3+ bound to CaM and DREAM(Δ64) as a function of the hydrophobic molecules TFP (top) bound to CaM and NS5806 (bottom) bound to DREAM(Δ64).
