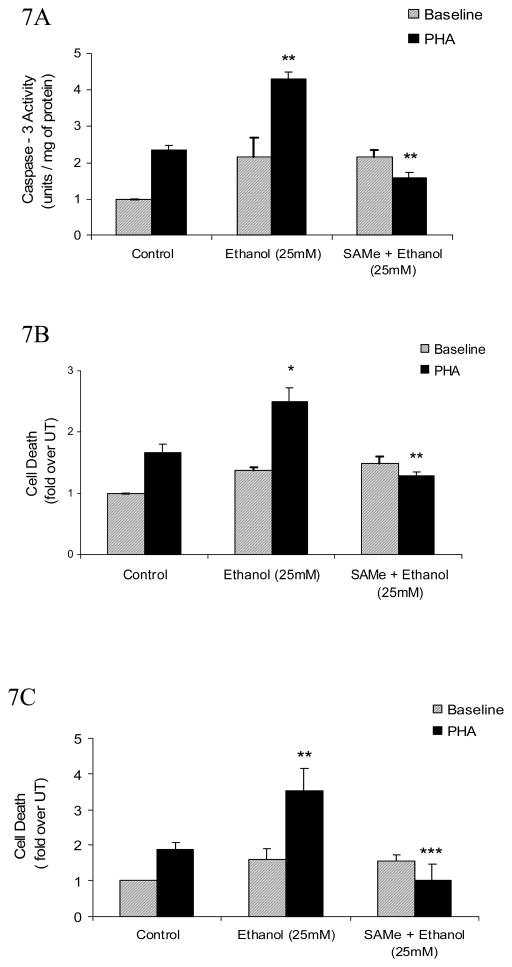
Fig. 7. SAMe supplementation decreases ethanol-mediated increase in caspase-3 and attenuates AICD in T lymphocytes.
A, Quantification of ethanol- mediated caspase-3 activity. Jurkat cells were untreated (control) or pretreated with SAMe (1mM) for 4h and then exposed to 25mM Ethanol for 24h with or without stimulation by PHA (5μg/ml, solid bars) for 8h. Cytoplasmic extracts were isolated and assayed for caspase-3 activity. Results are represented as mean ± SEM from three separate experiments and expressed as fold over untreated (which is set to 1). P values: ** P value < 0.01 when comparing Ethanol + PHA to PHA alone, and when comparing SAMe + Ethanol + PHA to Ethanol + PHA. B, DNA Fragmentation analysis of T (Jurkat) cells that were treated in the similar manner as mentioned above (Fig 7A). Results are represented as mean ± SEM from three separate experiments and expressed as fold over untreated (which is set to 1). P values: * P value < 0.05 when comparing Ethanol + PHA to PHA alone; ** P value < 0.01 when comparing SAMe + Ethanol + PHA to Ethanol + PHA. C, Exogenous SAMe supplementation significantly attenuates the ethanol – mediated AICD in MOLT-4 T cells. Cells (MOLT-4) were untreated (control) or pretreated with SAMe (1mM) for 4h and then exposed to 25mM Ethanol for 24h with or without stimulation by PHA (5μg/ml, solid bars) for 8h. AICD was quantified from cell extracts using the Cell Death detection ELISA assay. Results are represented as mean ± SEM from three separate experiments and expressed as fold over untreated (which is set to 1). P values: ** P value < 0.01 when comparing Ethanol + PHA to PHA alone; *** P value < 0.001 when comparing SAMe + Ethanol + PHA with Ethanol + PHA.

