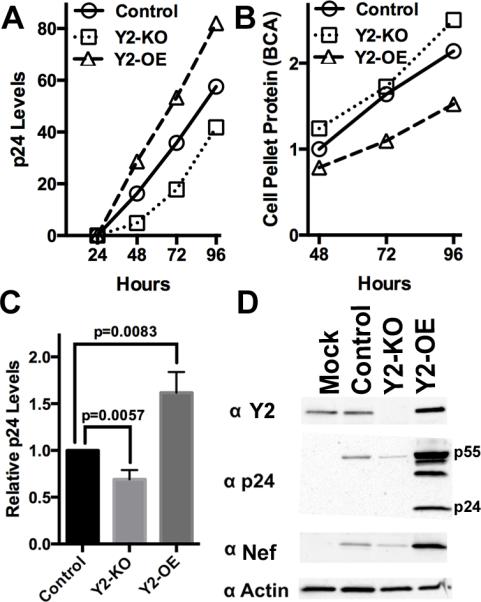
Figure 6. Recruitment of YTHDF2 to viral m6A editing sites boosts viral replication in CD4+ T cells.

(A) A representative growth curve for HIV-1 NL4-3 in control CEM-SS cells, in a CEM-SS sub-clone lacking a functional YTHDF2 gene (Y2-KO) or in a CEM-SS sub-clone overexpressing YTHDF2 (Y2-OE). HIV-1 replication was monitored by p24 ELISA. (B) This graph shows the total level of protein recovered from the cell pellets harvested at the indicated time points from the cultures analyzed in (A). (C) This bar graph shows the average of 3 independent replicate p24 ELISA growth curve experiments at 96 hpi, with significance of differences indicated. (D) A representative Western blot of samples treated as in (A) at 72 hpi. This Western analyzes the level of intracellular expression of HIV-1 p24, Nef and YTHDF2, with endogenous β-actin used as a loading control. Equal quantities of protein, as determined by BCA analysis, were loaded in each lane. Mock: mock infected culture. For related data, see Fig. S3.
