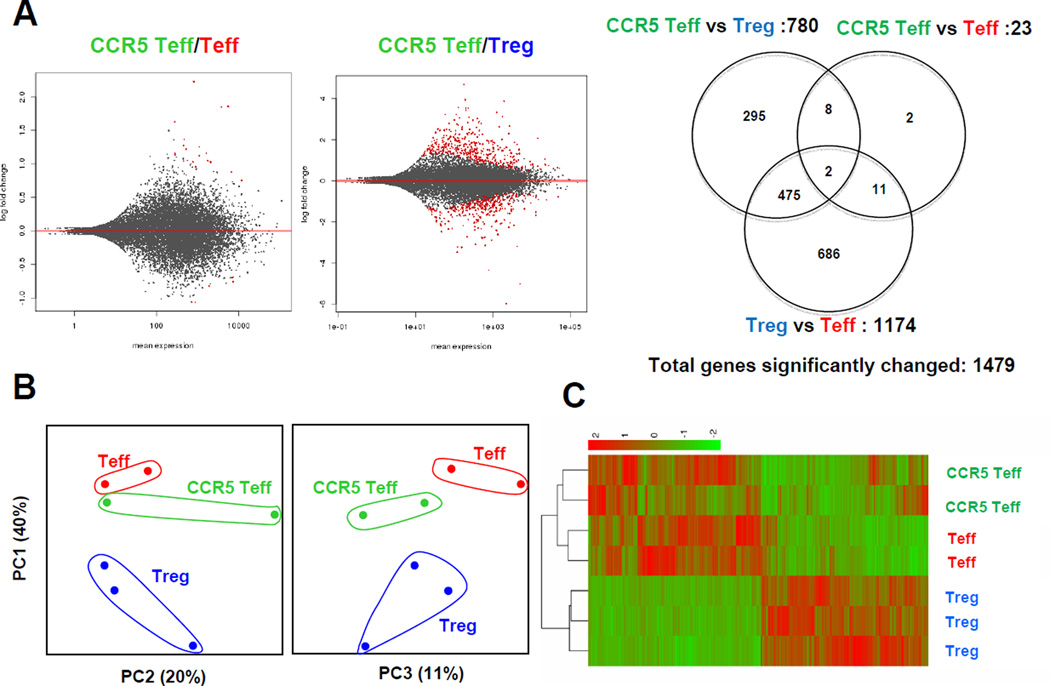
Figure 6. CCR5Teff cells are similar to effector T cells but not Tregs.
CCR5Teff (CD4+CCR5+CD25−), Tregs (CD4+CD25+) and Teff (CD4+CD25−CCR5−CD44hiCD62Llo) were sorted from the paLNs from Apoe−/− mice on WD for >5 months. RNA was extracted from the three populations, amplified, reverse transcribed and subjected to next generation sequencing (Illumina). A, The MA-plot shows the log fold changes as a function of the mean of normalized read counts. Genes with an adjusted p-value below 0.05 are shown in red. Venn diagram represents a summary of differentially expressed genes in the three contrasts as indicated. B, Principal component analysis of normalized read counts (n=14,839) shows the relatedness of samples. The first three principal components accounted for more than 70% of the total variance. C, Unsupervised clustering of the 1,479 differentially expressed genes also separates CCR5 Teff, Teff and Treg from all samples. The colors of the heatmap represent normalized gene counts (red as high).

