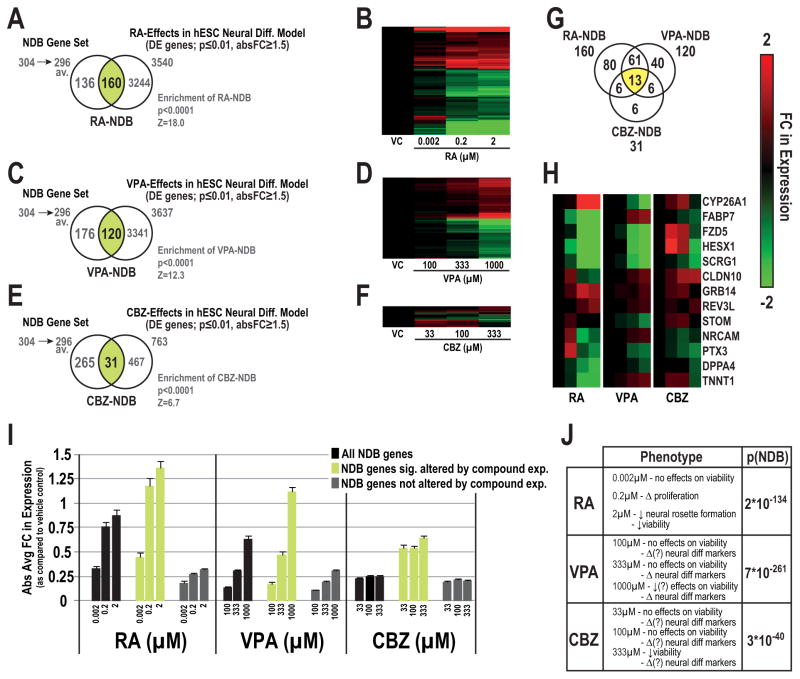
Figure 5.
Application of the NDB set to toxicogenomic studies investigating the effects of developmental toxicants in hESC neural differentiation models. Concentration-dependent effects on NDB genes whose expression was significantly altered by retinoic acid (RA-NDB; Venn, A, heatmap, B), valproic acid (VPA-NDB set; C, D) or carbmazepine (CBZ-NDB set, E, F) in hESC models of neural differentiation. Z-scores and p-values corresponding to enrichment of DE-NDB genes for each compound are listed below each respective Venn diagram. Distribution of shared and compound-specific NDB genes for the three compounds (G). Clustering analysis of shared NDB genes significantly altered by the three compounds (H). Absolute average FC values of all NDB genes together with DE- and non DE-NDB genes by compound (I). FC values are displayed for each concentration in relation to their respective vehicle control with standard error bars (log2 scale). Cellular and/or molecular phenotypes described by Colleoni et al.[50] or Schulpen et al. [51, 54] and Fisher’s combined probability test p-values (p[NDB]) for the complete NDB set across all concentrations (Table, J). Abbreviations: available for comparisons (av.).

