

Abstract
Prior studies observing associations between low levels of high-density lipoprotein (HDL) cholesterol and cardiovascular disease (CVD) have often been conducted among persons with metabolic or other lipid abnormalities. In this study, we investigated the association between primary low HDL cholesterol and coronary heart disease (CHD), CVD, and all-cause death after adjustment for confounders in the Multi-Ethnic Study of Atherosclerosis (MESA). Participants who were free of clinical CVD were recruited from 6 US research centers from 2000 to 2002 and followed for a median duration of 10.2 years. We defined “primary low HDL cholesterol” as HDL cholesterol level <40 mg/dL (men) or <50 mg/dL (women), triglyceride level <100 mg/dL, and low-density lipoprotein cholesterol level <100 mg/dL (n = 158). We defined an “optimal” lipid profile as HDL cholesterol ≥40 mg/dL (men) or ≥50 mg/dL (women) and triglycerides and low-density lipoprotein cholesterol <100 mg/dL (n = 780). For participants with primary low HDL cholesterol versus those with an optimal lipid profile, adjusted hazard ratios for total CHD, CVD, and death were 2.25 (95% confidence interval (CI): 1.20, 4.21; P = 0.011), 1.93 (95% CI: 1.11, 3.34; P = 0.020), and 1.11 (95% CI: 0.67, 1.84; P = 0.69), respectively. Participants with primary low HDL cholesterol had higher risks of CHD and CVD than participants with optimal lipid profiles but no difference in survival after a median 10.2 years of follow-up.
Keywords: cardiovascular disease, coronary disease, hyperlipidemia, lipids, lipoproteins
Over the last several decades, strong inverse relationships between low levels of high-density lipoprotein (HDL) cholesterol and both coronary heart disease (CHD) and cardiovascular disease (CVD) have been reported in epidemiologic studies (1). However, a critical shortcoming in the interpretation of these data is that low HDL cholesterol is commonly accompanied by increased triglyceride levels, which is consistent with an atherogenic dyslipidemia phenotype or “secondary” low HDL cholesterol rather than “primary” low HDL cholesterol. Atherogenic dyslipidemia is most commonly defined by the presence of elevated levels of triglycerides and remnant lipoproteins, smaller and more atherogenic low-density lipoprotein (LDL) particles, and low HDL cholesterol (2).
To determine whether primary low HDL cholesterol is associated with increased risk of CHD, it is most informative to focus on participants without known CHD whose sole lipoprotein abnormality is a low HDL cholesterol level with optimal LDL cholesterol and triglyceride levels (3, 4). While a recent meta-analysis encompassing 220,060 men and women from the Asia-Pacific region identified primary or “isolated” low HDL cholesterol as an independent risk factor for CHD (5), the cutpoints used for triglycerides (<200 mg/dL) and LDL cholesterol (<160 mg/dL) suggest that many of these subjects may have had mild-to-moderate atherogenic dyslipidemia, as opposed to true primary low HDL cholesterol.
The Multi-Ethnic Study of Atherosclerosis (MESA) includes data on CHD and CVD events occurring in a multiethnic cohort of men and women, and it represents an excellent opportunity to gain further insight into primary low HDL cholesterol. Our purpose in this study was to compare 10-year risks of CHD, CVD, and all-cause death in participants with primary low HDL cholesterol and those with optimal lipid profiles.
METHODS
MESA is an ongoing prospective study of the prevalence, progression, and prognostic significance of subclinical CVD. The design and methods of MESA have been described previously (6). Briefly, from 2000 to 2002, a total of 6,814 participants aged 45–84 years who identified as white, African-American, Hispanic, or Chinese were recruited at 6 academic centers in the United States (Columbia University (New York, New York); Johns Hopkins University (Baltimore, Maryland); Northwestern University (Chicago, Illinois); University of California, Los Angeles (Los Angeles, California); University of Minnesota (Minneapolis, Minnesota); and Wake Forest University (Winston-Salem, North Carolina)). All participants were free of clinical CVD at the time of enrollment. The study protocol was approved by the institutional review board at each site. All participants gave informed consent prior to enrollment. Anthropometric factors, lifestyle behaviors, medical history, and laboratory data were all assessed as described previously (6).
Study definitions
Consistent with prior cutpoints in the literature, “primary low HDL cholesterol” was defined as HDL cholesterol concentration <40 mg/dL (<1.0 mmol/L) for men and <50 mg/dL (<1.3 mmol/L) for women, triglyceride concentration <100 mg/dL (<1.1 mmol/L), and LDL cholesterol concentration <100 mg/dL (<2.6 mmol/L) (5, 7). An “optimal lipid profile” was defined as HDL cholesterol concentration ≥40 mg/dL for men and ≥50 mg/dL for women and LDL cholesterol and triglyceride concentrations <100 mg/dL.
Lipoprotein measurements
Baseline blood samples for measurement of serum lipoprotein levels were drawn from all participants between July 17, 2000, and August 29, 2002. Serum samples were processed and stored at −70°C and then sent to the Collaborative Studies Clinical Laboratory at Fairview University Medical Center (Minneapolis, Minnesota). Total cholesterol was measured from plasma using a cholesterol oxidase method on a Roche COBAS FARA centrifugal analyzer (Roche Diagnostics, Indianapolis, Indiana). HDL cholesterol was measured in ethylenediaminetetraacetic acid (EDTA) plasma using the cholesterol oxidase method (Roche Diagnostics) after precipitation of non-HDL cholesterol with magnesium/dextran. Triglyceride concentrations were measured in EDTA plasma using Triglyceride GB reagent (Roche Diagnostics) on the Roche COBAS FARA centrifugal analyzer. LDL cholesterol was calculated using the Friedewald equation (LDL cholesterol = total cholesterol − HDL cholesterol − triglycerides × 0.2) for participants with triglyceride levels less than 400 mg/dL.
Individual lipoprotein subclasses were measured by nuclear magnetic resonance spectroscopy using the LipoProfile-II spectral analysis process (LipoScience, Inc., Raleigh, North Carolina). In addition, calculated values for mean HDL particle size were provided. Further information on lipoprotein sampling is available on the MESA website (http://www.mesa-nhlbi.org).
Event outcomes
Three types of outcome events were included in this analysis: CHD, CVD, and all-cause death. CHD events consisted of myocardial infarction, death due to CHD, resuscitated cardiac arrest, definite angina, or probable angina followed by coronary revascularization. Cases of coronary artery revascularization that did not have a concurrent adjudicated diagnosis of angina were not included. The diagnosis of myocardial infarction was based on a combination of symptoms, electrocardiographic findings, and cardiac biomarkers. Death was considered related to CHD if it occurred within 28 days of a myocardial infarction, if the participant had experienced chest pain during the 72 hours prior to death, or if the participant had a history of CHD and died without documentation of other causes of death. A classification of definite or probable angina required clear documentation of symptoms without the development of myocardial infarction. Definite angina required objective evidence of reversible myocardial ischemia or obstructive coronary artery disease.
CVD events were defined as CHD events, stroke, death following a diagnosed stroke, or other atherosclerotic CVD. Stroke was based on either 1) the rapid onset of a focal neurological deficit lasting for 24 hours or until death or 2) evidence of a clinically relevant lesion upon brain imaging with a focal neurological deficit lasting less than 24 hours. Participants with focal deficits secondary to brain trauma, tumor, infection, or other nonvascular causes were excluded. “Hard” CHD events were defined as myocardial infarction, death due to CHD, or resuscitated cardiac arrest. “Hard” CVD events included hard CHD events as well as stroke or death following a recently diagnosed stroke.
Participants were contacted at intervals of 9–12 months, and information was collected regarding interim hospitalizations, outpatient CHD or CVD diagnoses, or deaths. Death certificates and medical records were requested. Next-of-kin interviews were conducted for out-of-hospital CVD deaths. Medical records were obtained for 98% of hospitalized CHD events and 95% of outpatient CVD diagnoses. Follow-up telephone interviews were completed for 92% of living participants. The last follow-up was conducted in May 2012. Further information on MESA follow-up methods is available online (http://www.mesa-nhlbi.org).
Statistical analysis
Of the 6,814 original participants, 158 had primary low HDL cholesterol and 780 had optimal lipid profiles. The median duration of follow-up was 10.2 years (interquartile range, 9.7–10.7). Baseline characteristics of participants with primary low HDL cholesterol and participants with optimal lipid profiles were tabulated and compared using Kruskal-Wallis rank tests.
The 3 primary outcomes of CHD, CVD, and all-cause death were evaluated using Cox proportional hazards models. Plots of Schoenfeld residuals did not show violations of the proportional hazards assumption (all P's > 0.05). Kaplan-Meier curves were used to plot unadjusted survival for participants with primary low HDL cholesterol as compared with those with optimal lipid profiles, and log-rank tests were used to compare the differences between the curves.
Hierarchical Cox proportional hazards models were constructed for each of the primary outcomes in order to adjust for confounding variables. Model 1 included the demographic variables of age, race/ethnicity, sex, income (as an indicator of socioeconomic status), and study site. Model 2 included the variables in model 1 as well as traditional risk factors, including hypertension, diabetes, and body mass index (weight (kg)/height (m)2). Model 3 included the variables in model 2 as well as lifestyle variables, including physical activity (metabolic equivalent of task (MET)-minutes/week) and alcohol intake (drinks/week). Model 4 included the variables in model 3 as well as medication variables, including use of any lipid-lowering medication and estrogen use.
We performed sensitivity analyses using various lipoprotein cutpoints in order to determine whether different definitions of optimal LDL cholesterol and triglyceride levels changed the results. The first analysis of event risk was performed with new LDL cholesterol cutpoints of <100 mg/dL, <130 mg/dL, and <160 mg/dL (<2.6 mmol/L, <3.4 mmol/L, and <4.1 mmol/L, respectively). The second analysis was performed with new triglyceride cutpoints of <100 mg/dL, <150 mg/dL, and <200 mg/dL (<1.1 mmol/L, <1.7 mmol/L, and <2.3 mmol/L, respectively).
All statistical analyses were performed with STATA, version 13.1 (StataCorp LP, College Station, Texas).
RESULTS
Baseline characteristics
Baseline characteristics of the participants with primary low HDL cholesterol and those with optimal lipid profiles are displayed in Table 1. Participants with optimal lipid profiles had higher income, lower body mass index, lower prevalence of hypertension, and lower prevalence of diabetes than participants with primary low HDL cholesterol (P < 0.05 for all). In the case of diabetes, the difference in prevalence between the groups was highly statistically significant, with double the prevalence (18% vs. 9%) of diabetes in the primary low HDL cholesterol group compared with the optimal lipid profile group (Table 1).
Table 1.
Baseline Characteristics of 938 Participants With Primary Low HDL Cholesterol Levels and Participants With Optimal Lipid Profiles, Multi-Ethnic Study of Atherosclerosis, 2000–2002
| Primary Low HDL Cholesterola (n = 158) |
Optimal Lipid Profileb (n = 780) |
P Value | |||||
|---|---|---|---|---|---|---|---|
| Median (IQR) | No. | % | Median (IQR) | No. | % | ||
| Demographic variables | |||||||
| Age, years | 60 (51–69) | 63 (53–72) | 0.079 | ||||
| Female sex | 87 | 55 | 403 | 52 | 0.44 | ||
| Race/ethnicity | 0.002 | ||||||
| White | 41 | 26 | 315 | 40 | |||
| Black | 79 | 50 | 282 | 36 | |||
| Hispanic | 25 | 16 | 113 | 15 | |||
| Chinese | 13 | 8 | 70 | 9 | |||
| Annual family income, dollars | 35,000–40,000 (20,000–75,000) | 40,000–50,000 (20,000–100,000) | 0.029 | ||||
| Risk factors | |||||||
| Body mass indexc | 29.4 (25.2–33.2) | 25.7 (22.9–29.4) | <0.001 | ||||
| Hypertension | 82 | 52 | 323 | 41 | 0.015 | ||
| Diabetes | 29 | 18 | 70 | 9 | <0.001 | ||
| Active smoking | 24 | 15 | 94 | 12 | 0.85 | ||
| Family history of CHD | 55 | 35 | 289 | 37 | 0.69 | ||
| Lifestyle variables | |||||||
| Current alcohol drinking | 127 | 80 | 659 | 84 | 0.12 | ||
| Alcohol intake, drinks/week | 1 (0–4) | 2 (0–7) | 0.11 | ||||
| Physical activity, MET-minutes/week | 4,028 (2,010–7,395) | 4,073 (2,175–7,178) | 0.057 | ||||
| Medication use | |||||||
| Statins | 31 | 20 | 144 | 18 | 0.74 | ||
| Fibrates | 5 | 3 | 5 | 1 | 0.049 | ||
| Niacin | 1 | 1 | 4 | 1 | 0.85 | ||
| ACEIs/ARBs | 35 | 22 | 133 | 17 | 0.13 | ||
| β blockers | 11 | 7 | 60 | 8 | 0.75 | ||
| Aspirin | 27 | 17 | 168 | 22 | 0.21 | ||
| Estrogen | 11 | 7 | 124 | 16 | 0.009 | ||
| Lipoprotein/laboratory characteristics | |||||||
| Total cholesterol | <0.001 | ||||||
| mg/dL | 140 (128–148) | 158 (147–170) | |||||
| mmol/L | 3.6 (3.3–3.8) | 4.1 (3.8–4.4) | |||||
| Triglycerides | <0.001 | ||||||
| mg/dL | 77 (63–89) | 66 (54–83) | |||||
| mmol/L | 0.9 (0.7–1.0) | 0.7 (0.6–0.9) | |||||
| LDL cholesterol | 0.37 | ||||||
| mg/dL | 85 (74–92) | 85 (76–94) | |||||
| mmol/L | 2.2 (1.9–2.4) | 2.2 (2.0–2.4) | |||||
| HDL cholesterol | <0.001 | ||||||
| mg/dL | 39 (36–45) | 60 (51–71) | |||||
| mmol/L | 1.0 (0.9–1.2) | 1.6 (1.3–1.8) | |||||
| HDL particles, μmol/L | 29 (26–32) | 36 (32–41) | <0.001 | ||||
| HDL particle size, nm | 9.1 (8.9–9.5) | 9.6 (9.3–9.9) | <0.001 | ||||
| C-reactive protein | <0.001 | ||||||
| mg/dL | 2.4 (1.0–4.5) | 1.3 (0.6–3.4) | |||||
| mg/L | 24 (10–45) | 13 (6–34) | |||||
Abbreviations: ACEIs, angiotensin-converting enzyme inhibitors; ARB, angiotensin receptor blockers; CHD, coronary heart disease; HDL, high-density lipoprotein; IQR, interquartile range; LDL, low-density lipoprotein; MET, metabolic equivalent of task.
a Primary low HDL cholesterol was defined as HDL cholesterol <50 mg/dL for women or <40 mg/dL for men, triglycerides <100 mg/dL, and LDL cholesterol <100 mg/dL.
b An optimal lipid profile was defined as HDL cholesterol ≥40 mg/dL for men or ≥50 mg/dL for women, triglycerides <100 mg/dL, and LDL cholesterol <100 mg/dL.
c Weight (kg)/height (m)2.
Events and mortality
A total of 146 discrete events (including death, nonfatal CHD, nonfatal stroke, or other nonfatal atherosclerotic disease) occurred during follow-up. Of these 146 events, there were 55 CHD events, 76 CVD events, and 131 deaths. Among the participants with primary low HDL cholesterol, 12% (n = 19) had CHD events, 15% (n = 23) had CVD events, and 15% (n = 24) died. Among the participants with optimal lipid profiles, 5% (n = 36) had CHD events, 7% (n = 53) had CVD events, and 14% (n = 107) died. CVD deaths comprised 42% (n = 10) of the deaths in primary low HDL cholesterol participants and 13% (n = 14) of the deaths in optimal lipid profile participants.
Unadjusted hazard ratios for CHD, CVD, and all-cause death for participants with primary low HDL cholesterol as compared with those with optimal lipid profiles (model 1) were 2.70 (95% confidence interval (CI): 1.55, 4.71; P < 0.001), 2.24 (95% CI: 1.37, 3.66; P = 0.001), and 1.13 (95% CI: 0.73, 1.77; P = 0.57), respectively (Table 2). Unadjusted Kaplan-Meier curves showed significant separation in the CHD and CVD event rates (Figures 1 and 2) for participants with primary low HDL cholesterol compared with those with optimal lipid profiles (in log-rank tests, P < 0.001 and P = 0.001, respectively). Unadjusted Kaplan-Meier curves showed no significant separation in all-cause death (Figure 3) for either group (P = 0.57 by log-rank test).
Table 2.
Estimated Risks of Coronary Heart Disease, Cardiovascular Disease, and All-Cause Death for Participants With Primary Low HDL Cholesterol Levels As Compared With Those With Optimal Lipid Profiles, Multi-Ethnic Study of Atherosclerosis, 2000–2012a
| Modelb | Outcome |
||||||||
|---|---|---|---|---|---|---|---|---|---|
| CHD |
CVD |
Death (All Causes) |
|||||||
| HR | 95% CI | P Value | HR | 95% CI | P Value | HR | 95% CI | P Value | |
| Unadjusted | 2.70 | 1.55, 4.71 | <0.001 | 2.24 | 1.37, 3.66 | 0.001 | 1.13 | 0.73, 1.77 | 0.57 |
| Model 1 | 2.96 | 1.63, 5.38 | <0.001 | 2.52 | 1.49, 4.26 | 0.001 | 1.19 | 0.73, 1.95 | 0.48 |
| Model 2 | 2.31 | 1.25, 4.29 | 0.008 | 1.90 | 1.11, 3.28 | 0.020 | 1.11 | 0.67, 1.84 | 0.67 |
| Model 3 | 2.32 | 1.24, 4.32 | 0.008 | 1.92 | 1.11, 3.32 | 0.020 | 1.11 | 0.67, 1.83 | 0.70 |
| Model 4 | 2.25 | 1.20, 4.21 | 0.011 | 1.93 | 1.11, 3.34 | 0.020 | 1.11 | 0.67, 1.84 | 0.69 |
Abbreviations: CHD, coronary heart disease; CI, confidence interval; CVD, cardiovascular disease; HDL, high-density lipoprotein; HR, hazard ratio; LDL, low-density lipoprotein; MET, metabolic equivalent of task.
a Primary low HDL cholesterol was defined as HDL cholesterol <50 mg/dL for women or <40 mg/dL for men, triglycerides <100 mg/dL, and LDL cholesterol <100 mg/dL. An optimal lipid profile was defined as HDL cholesterol ≥40 mg/dL for men or ≥50 mg/dL for women, triglycerides <100 mg/dL, and LDL cholesterol <100 mg/dL.
b Model 1 included age, race/ethnicity, sex, income, and study site. Model 2 included all variables in model 1 as well as hypertension, diabetes, and body mass index (weight (kg)/height (m)2). Model 3 included all variables in model 2 as well as the lifestyle variables of physical activity (MET-minutes/week) and alcohol intake (drinks/day). Model 4 included all of the variables in model 3 as well as medication variables, including use of lipid-lowering medication and estrogen.
Figure 1.
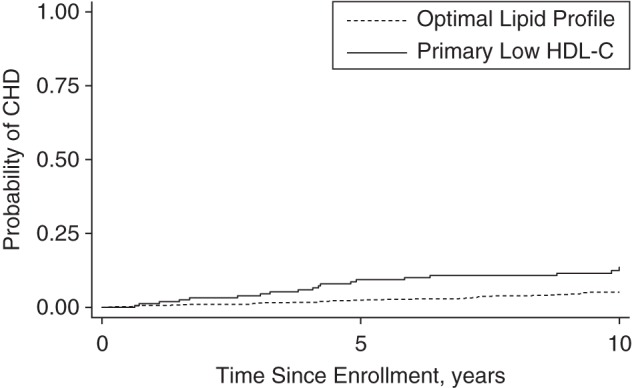
Unadjusted probability of coronary heart disease (CHD) events for participants with primary low levels of high-density lipoprotein cholesterol (HDL-C) as compared with those with optimal lipid profiles (P < 0.001 by log-rank test), Multi-Ethnic Study of Atherosclerosis, 2000–2012. Primary low HDL-C was defined as HDL-C <50 mg/dL for women or <40 mg/dL for men, triglycerides <100 mg/dL, and low-density lipoprotein cholesterol <100 mg/dL. An optimal lipid profile was defined as HDL-C ≥40 mg/dL for men or ≥50 mg/dL for women, triglycerides <100 mg/dL, and low-density lipoprotein cholesterol <100 mg/dL.
Figure 2.
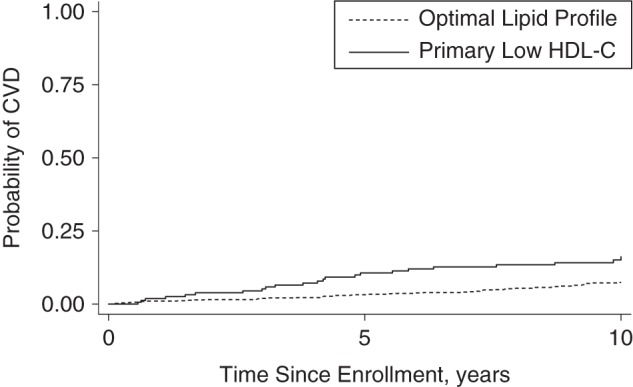
Unadjusted probability of cardiovascular disease (CVD) events for participants with primary low levels of high-density lipoprotein cholesterol (HDL-C) as compared with those with optimal lipid profiles (P = 0.001 by log-rank test), Multi-Ethnic Study of Atherosclerosis, 2000–2012. Primary low HDL-C was defined as HDL-C <50 mg/dL for women or <40 mg/dL for men, triglycerides <100 mg/dL, and low-density lipoprotein cholesterol <100 mg/dL. An optimal lipid profile was defined as HDL-C ≥40 mg/dL for men or ≥50 mg/dL for women, triglycerides <100 mg/dL, and low-density lipoprotein cholesterol <100 mg/dL.
Figure 3.
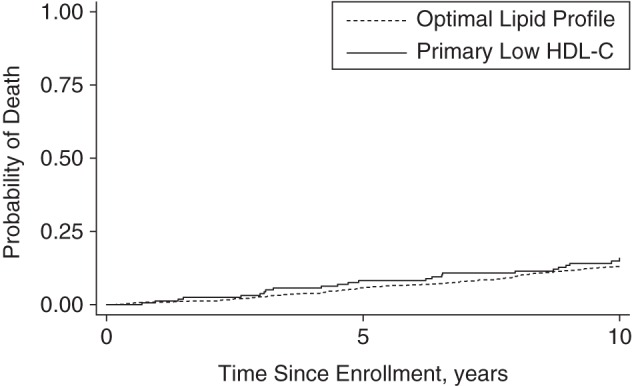
Unadjusted probability of all-cause death for participants with primary low levels of high-density lipoprotein cholesterol (HDL-C) as compared with those with optimal lipid profiles (P = 0.57 by log-rank test), Multi-Ethnic Study of Atherosclerosis, 2000–2012. Primary low HDL-C was defined as HDL-C <50 mg/dL for women or <40 mg/dL for men, triglycerides <100 mg/dL, and low-density lipoprotein cholesterol <100 mg/dL. An optimal lipid profile was defined as HDL-C ≥40 mg/dL for men or ≥50 mg/dL for women, triglycerides <100 mg/dL, and low-density lipoprotein cholesterol <100 mg/dL.
Upon hierarchical adjustment, significant associations were still seen for total CHD and CVD events as well as “hard” CHD and CVD events (Tables 2 and 3). Fully adjusted hazard ratios (model 4) for total CHD, CVD, and all-cause death were 2.25 (95% CI: 1.20, 4.21; P = 0.011), 1.93 (95% CI: 1.11, 3.34; P = 0.020), and 1.11 (95% CI: 0.67, 1.84; P = 0.69), respectively. The addition of angiotensin-converting enzyme inhibitor/angiotensin receptor blocker use, β blocker use, and diabetes medication use did not alter the risks of total CHD, CVD, or death any further (hazard ratio (HR) = 2.41, 95% CI: 1.28, 4.56 (P = 0.007); HR = 2.11, 95% CI: 1.21, 3.69 (P = 0.009); and HR = 1.13, 95% CI: 0.69, 1.89 (P = 0.62), respectively).
Table 3.
Estimated Risks of “Hard” Coronary Heart Disease and Cardiovascular Disease for Participants With Primary Low HDL Cholesterol Levels As Compared With Those With Optimal Lipid Profiles, Multi-Ethnic Study of Atherosclerosis, 2000–2012a
| Modelb | Outcome |
|||||
|---|---|---|---|---|---|---|
| Hard CHDc |
Hard CVDd |
|||||
| HR | 95% CI | P Value | HR | 95% CI | P Value | |
| Unadjusted | 3.08 | 1.59, 5.99 | 0.001 | 2.96 | 1.68, 5.20 | <0.001 |
| Model 1 | 2.82 | 1.38, 5.77 | 0.005 | 2.93 | 1.60, 5.38 | 0.001 |
| Model 2 | 2.48 | 1.18, 5.20 | 0.016 | 2.38 | 1.27, 4.49 | 0.007 |
| Model 3 | 2.34 | 1.11, 4.91 | 0.025 | 2.24 | 1.19, 4.21 | 0.013 |
| Model 4 | 2.25 | 1.07, 4.76 | 0.033 | 2.27 | 1.20, 4.28 | 0.011 |
Abbreviations: CHD, coronary heart disease; CI, confidence interval; CVD, cardiovascular disease; HDL, high-density lipoprotein; HR, hazard ratio; LDL, low-density lipoprotein; MET, metabolic equivalent of task.
a Primary low HDL cholesterol was defined as HDL cholesterol <50 mg/dL for women or <40 mg/dL for men, triglycerides <100 mg/dL, and LDL cholesterol <100 mg/dL. An optimal lipid profile was defined as HDL cholesterol ≥40 mg/dL for men or ≥50 mg/dL for women, triglycerides <100 mg/dL, and LDL cholesterol <100 mg/dL.
b Model 1 included age, race/ethnicity, sex, income, and study site. Model 2 included all variables in model 1 as well as hypertension, diabetes, and body mass index (weight (kg)/height (m)2). Model 3 included all variables in model 2 as well as the lifestyle variables of physical activity (MET-minutes/week) and alcohol intake (drinks/day). Model 4 included all of the variables in model 3 as well as medication variables, including use of lipid-lowering medication and estrogen.
c Hard CHD events were defined as myocardial infarction, death due to CHD, or resuscitated cardiac arrest.
d Hard CVD events included hard CHD events as well as stroke or death following a recently diagnosed stroke.
Sensitivity analyses
We compared unadjusted risks of CHD, CVD, and all-cause death for patients with primary low HDL cholesterol to risks for those with optimal lipid profiles at various LDL cholesterol (<100 mg/dL, <130 mg/dL, and <160 mg/dL) and triglyceride (<100 mg/dL, <150 mg/dL, <200 mg/dL) cutpoints. Overall, there did not appear to be important differences in the significance of the unadjusted risk of CHD, CVD, or death based on changes in the cutpoints (Table 4). Finally, interaction testing showed no significant interaction between primary low HDL cholesterol and sex (P = 0.95) or primary low HDL cholesterol and race/ethnicity (P = 0.20) in the survival analysis.
Table 4.
Unadjusted Risks of Coronary Heart Disease, Cardiovascular Disease, and All-Cause Death for Participants With Primary Low HDL Cholesterol Levels As Compared With Those With Optimal Lipid Profiles at Various LDL Cholesterol and Triglyceride Cutpoints, Multi-Ethnic Study of Atherosclerosis, 2000–2012
| Lipoprotein and Cutpoint | Outcome |
||||||||
|---|---|---|---|---|---|---|---|---|---|
| CHD |
CVD |
Death (All Causes) |
|||||||
| HR | 95% CI | P Value | HR | 95% CI | P Value | HR | 95% CI | P Value | |
| LDL cholesterol, mg/dLa | |||||||||
| <100 | 2.70 | 1.55, 4.71 | <0.001 | 2.24 | 1.37, 3.66 | 0.001 | 1.13 | 0.73, 1.77 | 0.57 |
| <130 | 2.07 | 1.38, 3.10 | <0.001 | 1.86 | 1.32, 2.60 | <0.001 | 0.93 | 0.66, 1.30 | 0.67 |
| <160 | 1.57 | 1.08, 2.28 | 0.018 | 1.49 | 1.09, 2.04 | 0.013 | 0.90 | 0.66, 1.22 | 0.48 |
| Triglycerides, mg/dLb | |||||||||
| <100 | 2.70 | 1.55, 4.71 | <0.001 | 2.24 | 1.37, 3.66 | 0.001 | 1.13 | 0.73, 1.77 | 0.57 |
| <150 | 2.03 | 1.31, 3.14 | 0.001 | 1.64 | 1.11, 2.43 | 0.013 | 1.14 | 0.82, 1.59 | 0.44 |
| <200 | 2.18 | 1.50, 3.17 | <0.001 | 1.71 | 1.23, 2.38 | 0.002 | 1.18 | 0.89, 1.57 | 0.25 |
Abbreviations: CHD, coronary heart disease; CI, confidence interval; CVD, cardiovascular disease; HDL, high-density lipoprotein; HR, hazard ratio; LDL, low-density lipoprotein.
a LDL cholesterol cutpoints of <100 mg/dL, <130 mg/dL, and <160 mg/dL are equivalent to <2.6 mmol/L, <3.4 mmol/L, and <4.1 mmol/L, respectively.
b Triglyceride cutpoints of <100 mg/dL, <150 mg/dL, and <200 mg/dL are equivalent to <1.1 mmol/L, <1.7 mmol/L, and <2.3 mmol/L, respectively.
DISCUSSION
Findings
In this study, we observed that participants with a primary low HDL cholesterol concentration had significantly higher risks of CHD and CVD (adjusted HR = 2.25 (95% CI: 1.20, 4.21) and adjusted HR = 1.93 (95% CI: 1.11, 3.34), respectively) after a median follow-up period of 10.2 years. However, despite the increases in CVD and CHD risk, there was no difference in all-cause mortality between the groups (adjusted HR = 1.11, 95% CI: 0.67, 1.84).
HDL particles exhibit a number of protective antiatherogenic effects, including mediating macrophage cholesterol efflux, protecting against LDL oxidation, reducing inflammation, maintaining endothelial function, and interfering with thrombosis (8–15). Consistent with these observations, low HDL cholesterol has been shown to be associated with premature CHD in several population-based studies (16–21). For example, early data from the Framingham Heart Study showed that myocardial infarction risk increased by approximately 25% for each 5-mg/dL decrease in HDL cholesterol below median values (22). Our results showing increased CVD risk with primary low HDL cholesterol even after adjustment for potential confounding in a multiethnic, contemporary cohort of adult men and women confirm the prior findings in the literature.
In contrast to these prior observational data, Mendelian randomized analyses of 54,000 participants showed that genetically low HDL cholesterol levels were not associated with higher CHD risk and genetically high HDL cholesterol levels were not associated with lower CHD risk (23, 24). Furthermore, few randomized controlled trials have demonstrated clinical improvement in CVD outcomes with HDL cholesterol-raising therapies. The AIM-HIGH trial was among the most notable randomized controlled trials designed to evaluate the effectiveness of niacin therapy in increasing HDL cholesterol (25). At 3 years, participants treated with niacin had increased levels of HDL cholesterol (25.0% vs. 9.8%) but still showed no reduction in the composite endpoint of death from CHD, nonfatal myocardial infarction, or CVD (16.4% vs. 16.2%; HR = 1.02, 95% CI: 0.87, 1.21). Similarly, the HPS2-THRIVE, ILLUMINATE, and dal-OUTCOMES trials also failed to show a reduction in CVD events with HDL-raising therapies in a prospective, prespecified fashion (26–28).
There are several possible explanations for the conflicting data noted above. First, previously observed associations between primary low HDL cholesterol and CVD events were confounded by residual factors that were not adequately adjusted for in the analyses. Second, primary low HDL cholesterol could be causal in the CVD pathway, but randomized controlled trials of HDL cholesterol-raising therapy may have been challenged by limited efficacy, unanticipated side effects, or competing effects of background statin therapy. Third, perhaps simply increasing the enrichment of cholesterol in the HDL fraction with medications does not necessarily correlate with augmentation of HDL functionality or an increase in benefit attributable to the HDL fraction as a whole.
Interestingly, even though we found CHD and CVD risks to be increased for primary low HDL cholesterol participants, we did not find a difference in overall survival in comparison with optimal lipid profile participants. Improvements in cardiovascular care have made it such that cardiac death has become considerably less frequent than previously. Since 1968, death from CHD has continued to steadily decline in the United States due to improvements in early CHD identification, therapeutic improvements, and invasive interventions (29). Accordingly, it is not uncommon to note increased CVD risk without necessarily seeing increased mortality in contemporary cohorts such as MESA. It is also possible that a median follow-up duration of 10 years is not adequate to note survival differences due to small effect sizes for low HDL cholesterol, especially when both of the study groups had LDL cholesterol and triglyceride values less than 100 mg/dL. Large studies with longer durations of follow-up are needed to further assess the relationship between low HDL cholesterol, CVD, and long-term survival in a longitudinal fashion.
Strengths and limitations
There were several strengths of this study. First, this was a contemporary, multiethnic, multicenter cohort study of both men and women, unlike several prior cohort studies evaluating HDL cholesterol. This makes the results more generalizable across clinical populations. Second, there was sufficient duration of follow-up to detect important associations with confidence. Third, all participants were free of CVD at baseline, which allowed us to truly capture risk in the primary prevention population.
There were also several limitations that are worth noting. First, the sample of primary low HDL cholesterol participants was relatively small (n = 158). However, we identified all MESA participants who fitted this lipid profile across the cohort. Second, there was a lack of long-term information in this study regarding the degree of control for cardiac risk factors, including hypertension and diabetes. The cardiac outcome of a patient with poorly controlled hypertension or diabetes may be very different from that of a patient with excellent blood pressure and blood sugar control. We have shown that after correcting for baseline use of angiotensin-converting enzyme inhibitors/angiotensin receptor blockers, β blockers, and diabetic medication, there was no significant change in the risk estimates for CHD or CVD events between the groups, but data regarding long-term risk factor control remain important for further characterization of these relationships. Third, this being an observational cohort study, it was subject to residual confounding despite statistical adjustment in multivariable models. In addition, there is always a chance of overadjustment of results that may lead to inaccurate risk estimation. To reduce the chances of overfitting the models, we produced hierarchical iterations of Cox models in order to clearly identify where confounding occurred the most. We also included interaction testing to ensure that the relationships of low HDL cholesterol with sex and race/ethnicity were not additive to the observed CVD risk. Finally, we included sensitivity analyses to ensure that our findings were not secondary to chance selection of certain lipoprotein definitions.
Conclusion
The results of our study showed that participants with primary low HDL cholesterol had higher risks of CHD and CVD than participants with optimal lipid profiles but no change in median 10-year survival. Further studies are needed to explore any causality between primary low HDL cholesterol and CVD and long-term mortality.
ACKNOWLEDGMENTS
Author affiliations: Ciccarone Center for the Prevention of Heart Disease, Johns Hopkins Hospital, Baltimore, Maryland (Haitham M. Ahmed, Khurram Nasir, John W. McEvoy, Roger S. Blumenthal, Michael J. Blaha); Division of Cardiology, School of Medicine, University of Maryland, Baltimore, Maryland (Michael Miller); Center for Prevention and Wellness Research, Baptist Health Medical Group, Miami Beach, Florida (Khurram Nasir); Department of Medicine, Herbert Wertheim College of Medicine, Miami, Florida (Khurram Nasir); Department of Epidemiology, Robert Stempel College of Public Health, Miami, Florida (Khurram Nasir); and Division of Cardiology, School of Medicine, Wake Forest University, Winston-Salem, North Carolina (David Herrington).
All authors contributed equally to this work.
This work was supported by National Heart, Lung, and Blood Institute grant R01-HL071739 and by National Institutes of Health contracts N01-HC-95159 through N01-HC-95166 and N01-HC-95169.
Conflict of interest: none declared.
REFERENCES
- 1.Gordon T, Castelli WP, Hjortland MC et al. High density lipoprotein as a protective factor against coronary heart disease. The Framingham Study. Am J Med. 1977;625:707–714. [DOI] [PubMed] [Google Scholar]
- 2.Grundy SM. Small LDL, atherogenic dyslipidemia, and the metabolic syndrome. Circulation. 1997;951:1–4. [DOI] [PubMed] [Google Scholar]
- 3.Grundy SM, Cleeman JI, Merz CN et al. Implications of recent clinical trials for the National Cholesterol Education Program Adult Treatment Panel III Guidelines . J Am Coll Cardiol. 2004;443:720–732. [DOI] [PubMed] [Google Scholar]
- 4.Miller M, Stone NJ, Ballantyne C et al. Triglycerides and cardiovascular disease: a scientific statement from the American Heart Association. Circulation. 2011;12320:2292–2333. [DOI] [PubMed] [Google Scholar]
- 5.Huxley RR, Barzi F, Lam TH et al. Isolated low levels of high-density lipoprotein cholesterol are associated with an increased risk of coronary heart disease: an individual participant data meta-analysis of 23 studies in the Asia-Pacific region. Circulation. 2011;12419:2056–2064. [DOI] [PubMed] [Google Scholar]
- 6.Bild DE, Bluemke DA, Burke GL et al. Multi-Ethnic Study of Atherosclerosis: objectives and design. Am J Epidemiol. 2002;1569:871–881. [DOI] [PubMed] [Google Scholar]
- 7.Miller M, Kim Y, Havas S et al. Low HDL-C and prediction of CHD risk in subjects with normal TG and LDL-C levels. The Framingham Offspring Study [abstract] J Am Coll Cardiol. 2014;63(12_S):A1286. [Google Scholar]
- 8.Barter PJ, Nicholls S, Rye KA et al. Antiinflammatory properties of HDL. Circ Res. 2004;958:764–772. [DOI] [PubMed] [Google Scholar]
- 9.Oram JF, Johnson CJ, Brown TA. Interaction of high density lipoprotein with its receptor on cultured fibroblasts and macrophages. Evidence for reversible binding at the cell surface without internalization. J Biol Chem. 1987;2625:2405–2410. [PubMed] [Google Scholar]
- 10.Kuhn FE, Mohler ER, Satler LF et al. Effects of high-density lipoprotein on acetylcholine-induced coronary vasoreactivity. Am J Cardiol. 1991;6815:1425–1430. [DOI] [PubMed] [Google Scholar]
- 11.Kontush A, Chantepie S, Chapman MJ. Small, dense HDL particles exert potent protection of atherogenic LDL against oxidative stress. Arterioscler Thromb Vasc Biol. 2003;2310:1881–1888. [DOI] [PubMed] [Google Scholar]
- 12.Saku K, Ahmad M, Glas-Greenwalt P et al. Activation of fibrinolysis by apolipoproteins of high density lipoproteins in man. Thromb Res. 1985;391:1–8. [DOI] [PubMed] [Google Scholar]
- 13.Griffin JH, Kojima K, Banka CL et al. High-density lipoprotein enhancement of anticoagulant activities of plasma protein S and activated protein C. J Clin Invest. 1999;1032:219–227. [DOI] [PMC free article] [PubMed] [Google Scholar]
- 14.Epand RM, Stafford A, Leon B et al. HDL and apolipoprotein A-I protect erythrocytes against the generation of procoagulant activity. Arterioscler Thromb. 1994;1411:1775–1783. [DOI] [PubMed] [Google Scholar]
- 15.Aoyama T, Yui Y, Morishita H et al. Prostaglandin I2 half-life regulated by high density lipoprotein is decreased in acute myocardial infarction and unstable angina pectoris. Circulation. 1990;816:1784–1791. [DOI] [PubMed] [Google Scholar]
- 16.Genest JJ Jr, Martin-Munley SS, McNamara JR et al. Familial lipoprotein disorders in patients with premature coronary artery disease. Circulation. 1992;856:2025–2033. [DOI] [PubMed] [Google Scholar]
- 17.Buring JE, O'Connor GT, Goldhaber SZ et al. Decreased HDL2 and HDL3 cholesterol, Apo A-I and Apo A-II, and increased risk of myocardial infarction. Circulation. 1992;851:22–29. [DOI] [PubMed] [Google Scholar]
- 18.Genest J Jr, McNamara JR, Ordovas JM et al. Lipoprotein cholesterol, apolipoprotein A-I and B and lipoprotein (a) abnormalities in men with premature coronary artery disease. J Am Coll Cardiol. 1992;194:792–802. [DOI] [PubMed] [Google Scholar]
- 19.Kwiterovich PO Jr, Coresh J, Bachorik PS. Prevalence of hyperapobetalipoproteinemia and other lipoprotein phenotypes in men (aged < or = 50 years) and women (< or = 60 years) with coronary artery disease. Am J Cardiol. 1993;718:631–639. [DOI] [PubMed] [Google Scholar]
- 20.Genest J Jr, Bard JM, Fruchart JC et al. Familial hypoalphalipoproteinemia in premature coronary artery disease. Arterioscler Thromb. 1993;1312:1728–1737. [DOI] [PubMed] [Google Scholar]
- 21.The Bezafibrate Infarction Prevention (BIP) Study Group, Israel. Lipids and lipoproteins in symptomatic coronary heart disease. Distribution, intercorrelations, and significance for risk classification in 6,700 men and 1,500 women. Circulation. 1992;863:839–848. [DOI] [PubMed] [Google Scholar]
- 22.Castelli WP. Cardiovascular disease and multifactorial risk: challenge of the 1980s. Am Heart J. 1983;1065:1191–1200. [DOI] [PubMed] [Google Scholar]
- 23.Haase CL, Tybjærg-Hansen A, Grande P et al. Genetically elevated apolipoprotein A-I, high-density lipoprotein cholesterol levels, and risk of ischemic heart disease. J Clin Endocrinol Metab. 2010;9512:E500–E510. [DOI] [PubMed] [Google Scholar]
- 24.Haase CL, Tybjærg-Hansen A, Qayyum AA et al. LCAT, HDL cholesterol and ischemic cardiovascular disease: a Mendelian randomization study of HDL cholesterol in 54,500 individuals. J Clin Endocrinol Metab. 2012;972:E248–E256. [DOI] [PubMed] [Google Scholar]
- 25.Boden WE, Probstfield JL, Anderson T et al. Niacin in patients with low HDL cholesterol levels receiving intensive statin therapy. N Engl J Med. 2011;36524:2255–2267. [DOI] [PubMed] [Google Scholar]
- 26.HPS2-THRIVE Collaborative Group Landray MJ, Haynes R et al. Effects of extended-release niacin with laropiprant in high-risk patients. N Engl J Med. 2014;3713:203–212. [DOI] [PubMed] [Google Scholar]
- 27.Barter PJ, Caulfield M, Eriksson M et al. Effects of torcetrapib in patients at high risk for coronary events. N Engl J Med. 2007;35721:2109–2122. [DOI] [PubMed] [Google Scholar]
- 28.Schwartz GG, Olsson AG, Abt M et al. Effects of dalcetrapib in patients with a recent acute coronary syndrome. N Engl J Med. 2012;36722:2089–2099. [DOI] [PubMed] [Google Scholar]
- 29.National Heart, Lung, and Blood Institute. Morbidity & Mortality: 2012 Chart Book on Cardiovascular, Lung, and Blood Diseases. Bethesda, MD: National Heart, Lung, and Blood Institute; 2012. [Google Scholar]