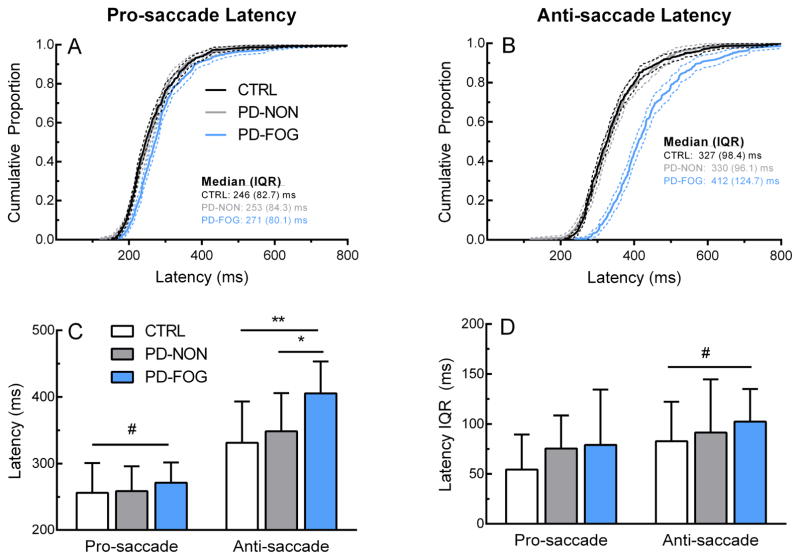
Figure 2.
Saccade latency. Top row: Latency distributions for pro-saccade (A) and anti-saccade (B). Bottom row: Group mean (C) and variability (D) of pro-saccade and anti-saccade latency across groups. Dotted lines in (A) and (B) represent 95% confidence bands. Error bars in (C) and (D) represent ± 1 SD. *p<0.05, **p<0.01 (between-subjects effect), #p<0.05 (within-subjects effect)

