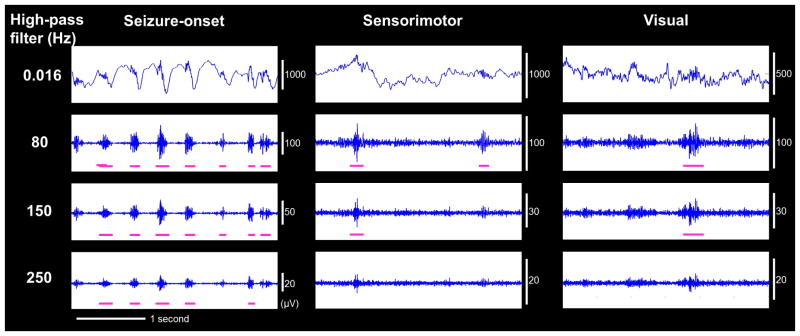
Figure 1. ECoG during interictal state in patient #1.
Interictal ECoG traces at (A) seizure-onset, (B) nonepileptic sensorimotor, and (C) nonepileptic visual sites are shown with high-pass filter at 0.016, 80, 150, and 250 Hz. High-frequency oscillations (HFOs) were accompanied by a steep slow wave at the seizure-onset site but a dull slow wave at the nonepileptic sensorimotor and visual sites.

