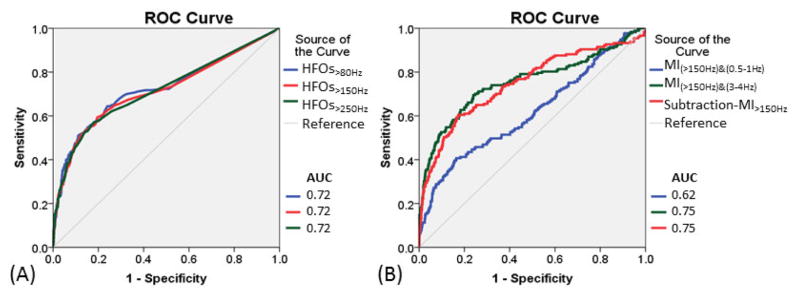
Figure 2. Seizure-onset localization by HFOs and modulation index (MI) measures.
(A) Receiver-operating characteristics (ROC) curves for localization of seizure-onset sites using rates of HFOs>80Hz (blue line), HFOs>150Hz (red line), and HFOs>250Hz (green line). (B) ROC curves for localization of seizure-onset sites using MI(>150Hz)&(0.5–1Hz) (blue line), MI(>150Hz)&(3–4Hz), (green line), and subtraction-MI>150Hz (defined as subtraction of MI(>150Hz)&(0.5–1Hz) from MI(>150Hz)&(3–4Hz) [red line]).

