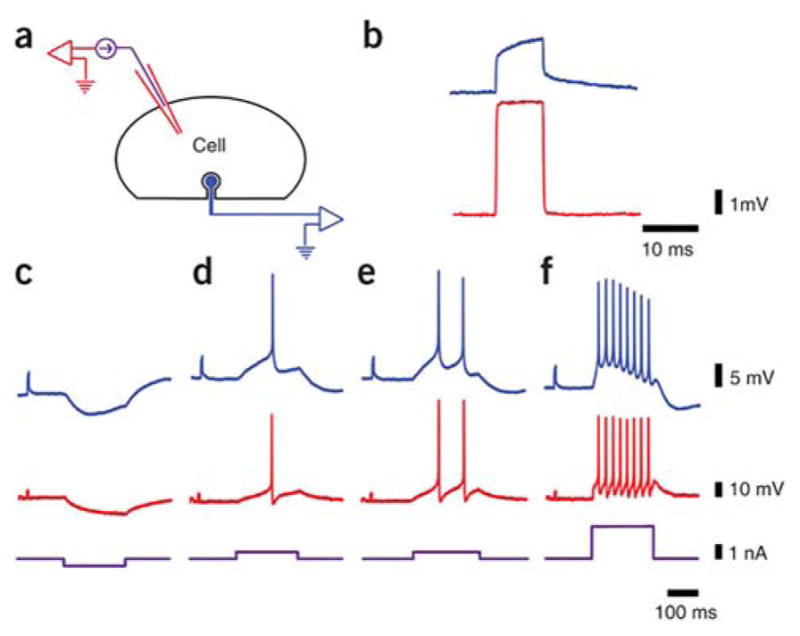
Figure 21.

Intracellular-like recordings with FGSEs. (a) Experimental setup with one cell interfaced to a single glass microelectrode (red) and FGSE (blue). (b) Calibrated recording from the intracellular microelectrode (red) and FGSE (blue) for a pulse of 5 mV, 20 ms, (c) A hyperpolarizing current pulse (purple) induced hyperpolarization recorded by the intracellular microelectrode (red) and the FGSE (blue). (d–f) Depolarizing currents generated action potentials with amplitudes of ~50 mV (intracellular microelectrode, red) and ~25 mV (FGSE, blue). Reprinted with permission from Ref. 553. Copyright 2010 Nature Publishing Group.
