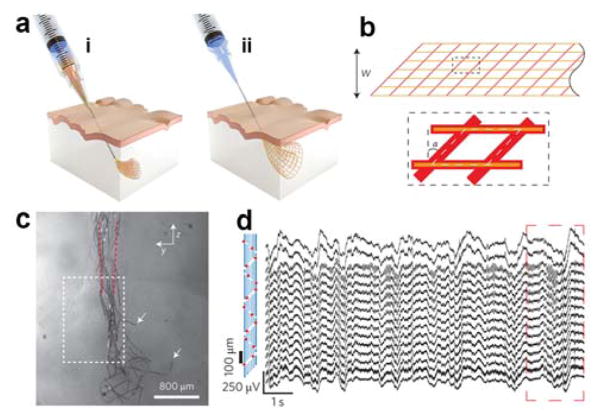
Figure 29.
(a) Schematics for injectable electronics. The needle is inserted (i) and retracted (ii) to leave the mesh electronics in the cavity. (b) Schematic of the mesh design, where α is the angle with respect to a rectangular configuration. (c) Optical image of a longitudinal brain slice taken five weeks after injection into the hippocampus. The mesh is fully extended. (d) 16-channel recording with the mesh electronics following injection into the brain of a live mouse. Reprinted with permission from Ref. 23. Copyright 2015 Nature Publishing Group.

