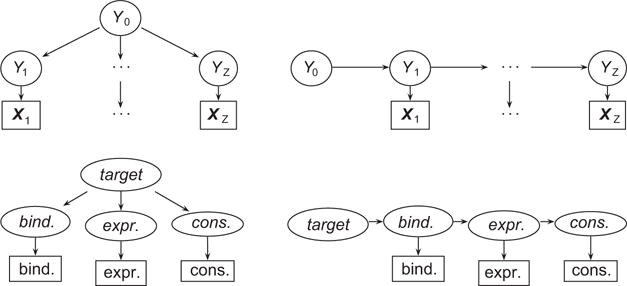
Figure 1.

The layered (left) and chained (right) mixture models. The general model is shown in the upper row. Ovals indicate hidden variables, while rectangles indicate observed variables. Arrows show generative relationships, which account for all dependencies between variables. The specific model is shown in the lower row, with binding corresponding to z=1, expression to z=2, and conservation to z=3. Names of hidden data are in italics, while upright typeface indicates observed data.
