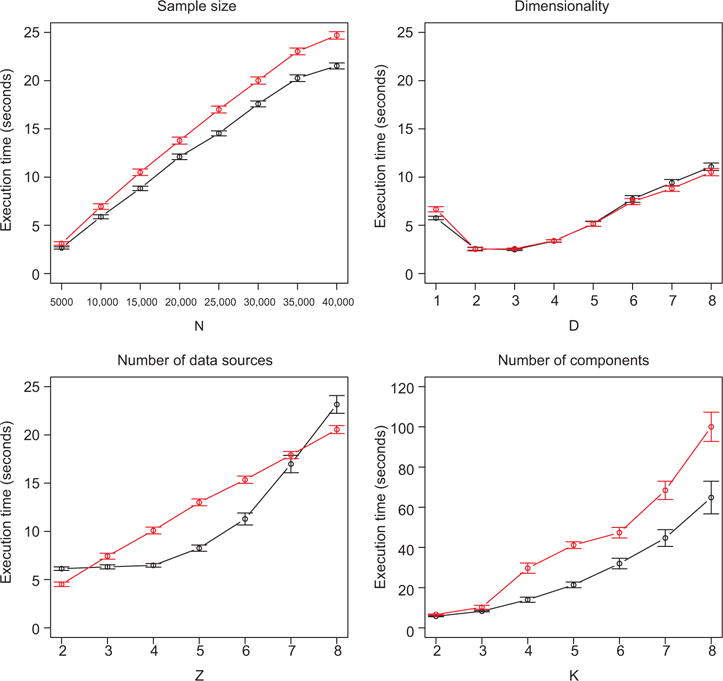
Figure 4.

Mean execution times across simulations for layered (black) and chained (red) data, for various model specifications. Error bars show 95% confidence bounds based on standard error. Default values are N=10,000, D=1, Z=3, and K=2, unless otherwise specified. Note that the y-axis scale for the “number of components” plot differs from the others.
