Figure 4.


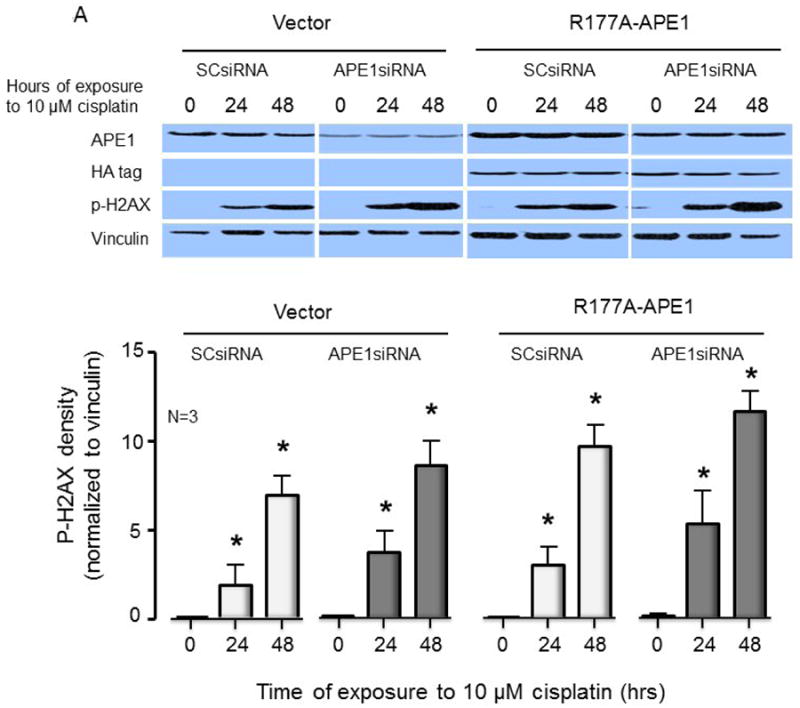
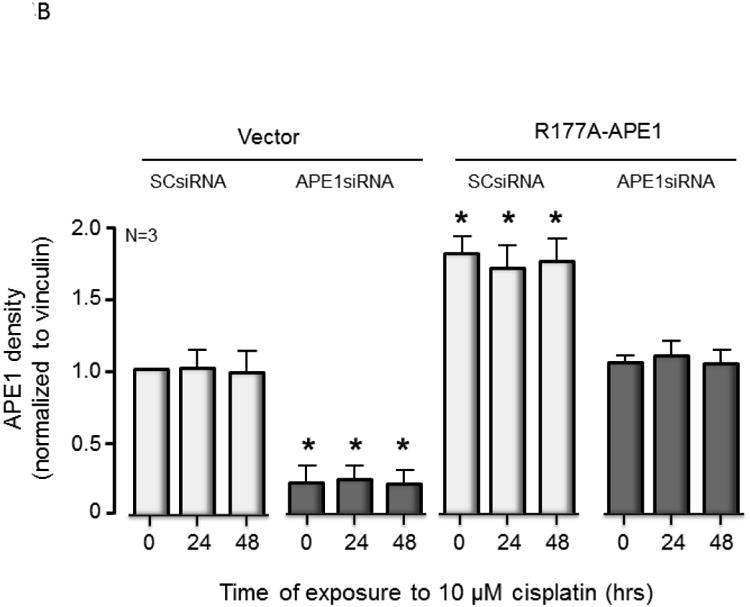
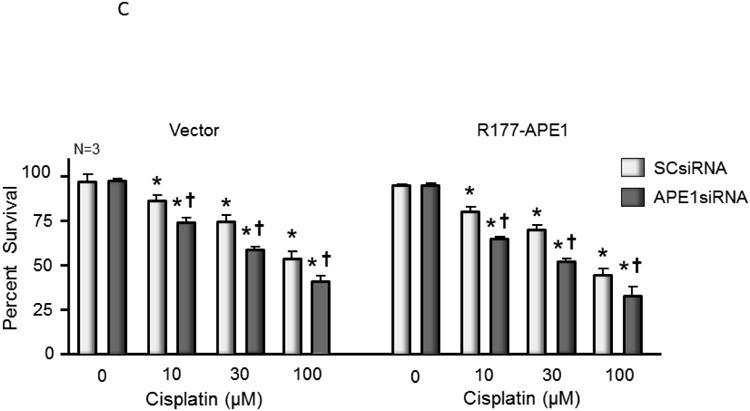
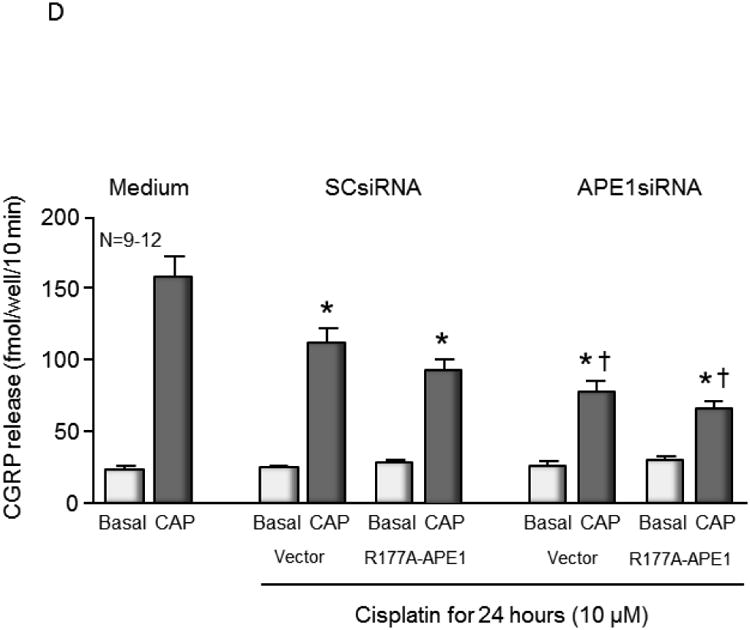
Overexpression of R177A APE1 in cisplatin-treated sensory neurons has no effect on DNA damage; levels of cell death or neurotransmitter release were comparable to control samples. (A) The top panels show representative Western blots of APE1, HA, phospho-H2AX (p-H2AX) and vinculin from cultures prior to and after 24 and 48 hours of exposure to 10 μM cisplatin. Cultures were exposed to 100 nM SCsiRNA or APE1siRNA and infected with lentiviral constructs containing EGFP (vector) or R177A-APE1 as indicated. The bottom panels represent the densitometry of p-H2AX expression normalized to vinculin from 3 independent experiments. The columns represent the mean ± SEM from cultures treated with SCsiRNA (lightly shaded columns) or APE1siRNA (heavy shaded columns) prior to or after exposure to 10 μM cisplatin. An asterisk indicates a statistically significant increase in P-H2AX density in each group compared to cells not exposed to cisplatin. (B) Each column represents the mean ± SEM densitometry of APE 1expression normalized to vinculin from 3 independent experiments from Figure 4A for cultures treated with SCsiRNA (lightly shaded columns) or APE1siRNA (heavy shaded columns) then viral infection prior to or after exposure to 10 μM cisplatin. An asterisk indicates a statistically significant increase in APE1 density cells treated with APE1siRNA compared to those treated with SCsiRNA. (C) Each column represents the mean ± SEM of percent survival of cells from cultures treated with SCsiRNA (open columns) or APE1siRNA (shaded columns) then treated with various concentrations of cisplatin for 24 hours. The panel on the left represents cells infected with control lentivirus, whereas the panel on the right represents cells infected with lentivirus containing the R177A APE1 construct. An asterisk indicates a significant difference in survival after cisplatin compared to controls, whereas a cross indicates a significant difference in cultures treated with APE1siRNA using ANOVA and Tukey's post hoc test. (D) Each column represents the mean ± SEM of basal CGRP release (open columns) or capsaicin-stimulated release (shaded columns) in fmol/well/min. Cultures are untreated (medium control from Figure 3C) or treated with SCsiRNA or APE1siRNA and infected with lentivirus containing EGFP (vector) or the R177A APE1construct as indicated prior to a 24 hour exposure to 10 μM cisplatin. An asterisk indicates a significant difference in capsaicin-stimulated release after cisplatin compared to medium controls, whereas a cross indicates a significant difference in APE1siRNA treated cultures compared to SCsiRNA treated cultures.
