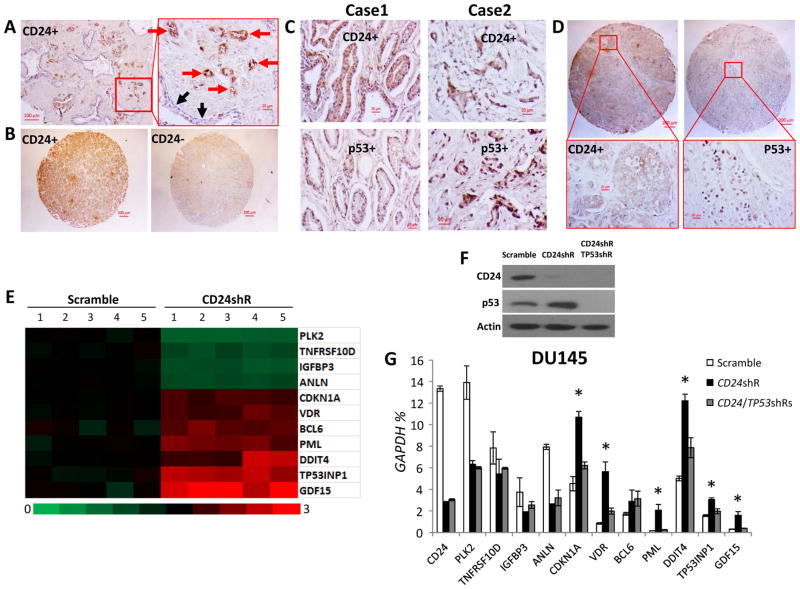
Figure 1.
CD24 and mutant p53 and their regulated gene expressions in human PCa cells. (A) A representative histology of PCas shows CD24 staining in PCa cells but no staining in normal prostate epithelial cells from the same patient. The red and black arrows indicate PCa cells and normal prostate epithelial cells, respectively. (B) A representative CD24 staining of TMA PCa samples. (C and D) Representative IHC data showing co-expression of CD24 and mutant p53 in primary cancer samples from two representative cases and TMA samples from the same case, using monoclonal anti-CD24 and p53 antibodies, respectively. (E) A heat-map depiction of alterations in p53 target gene expression in DU145 cells following CD24 gene silencing was generated from Affymetrix Human U133 Plus 2.0 microarrays. The microarray data were submitted to NCBI GEO (accession No. GSE46708). (F) Silencing of CD24 and TP53 by shRNAs was validated by Western blots. (G) The mRNA expression of p53 target genes was validated by qPCR. Data are presented as the means and SD of triplicates. The relative amounts are expressed as percentages of GAPDH. * p < 0.05 when CD24 shRNA was compared with scramble control and CD24/TP53 shRNAs (two-tailed t test). shR, shRNA. All experiments were repeated three times.

