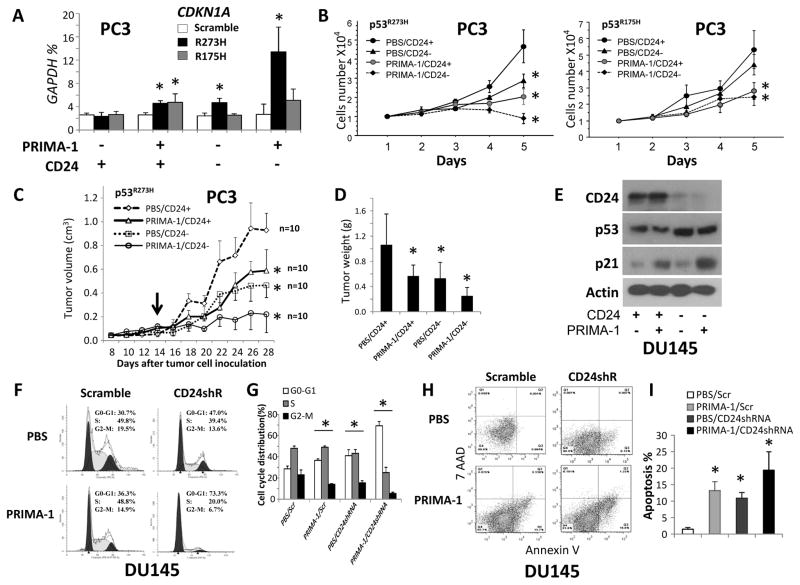
Figure 3.
Effect of CD24 in PRIMA-1-induced restoration of mutant p53 and p53-denpendent cell growth suppression, cell cycle arrest, and apoptosis. (A) Quantification of CDKN1A expression after transfection of scramble, TP53R175H, or TP53R273H with treatment of PRIMA-1 in CD24+ and CD24− PC3 cells. The relative amounts are expressed as percentages of GAPDH. Data are presented as the means and SD of triplicates. (B) Cell proliferation after transfection of scramble, TP53R175H, or TP53R273H with treatment of PRIMA-1 in CD24+ or CD24− PC3 cells. Left panel: growth curves of TP53R273H-transfected PC3 cells. Right panel: growth curves of TP53R175H-transfected PC3 cells. *p <0.05, Fisher’s PLSD test. (C) Tumor growth in NSG mice subcutaneously injected with TP53R273H-transfected CD24+ or CD24− PC3 cells with or without PRIMA-1. The black arrow indicates the starting time of treatment with PBS or PRIMA-1 (every other day for two weeks). Data are presented as the means and SD of the tumor volumes; the experiments were repeated 2 times. * p < 0.05, Fisher’s PLSD test. n, sample size. (D) Weights of tumors at day 28 after injection. Data are presented as the means and SD of the tumor weights. * p < 0.05, two-tailed t test. (E) p21 and p53 expressions in CD24+ or CD24− (CD24shRNA-transduced) DU145 cells treated with or without PRIMA-1 for 48 hours were measured by Western blots. The DU145 cells carry endogenous mutant p53P223L/V274F. (F) After starvation of cells for 48 hours, cell cycle progression in CD24+ or CD24− DU145 cells was determined by propidium iodide staining and flow cytometry at 24 hours. (G) Quantitative cell cycle data are presented as the means and SD of triplicates. * p < 0.05 against PBS/Scr group, Fisher’s PLSD test. (H) Apoptosis in CD24+ or CD24− DU145 cells was detected by Annexin V/7-AAD staining at 5 days after treatment with PRIMA-1. (I) Quantitative apoptosis data are presented as the means and SD of triplicates. * p < 0.05 against the PBS/Scr group, two-tailed t test. All above in vitro experiments were repeated three times.

