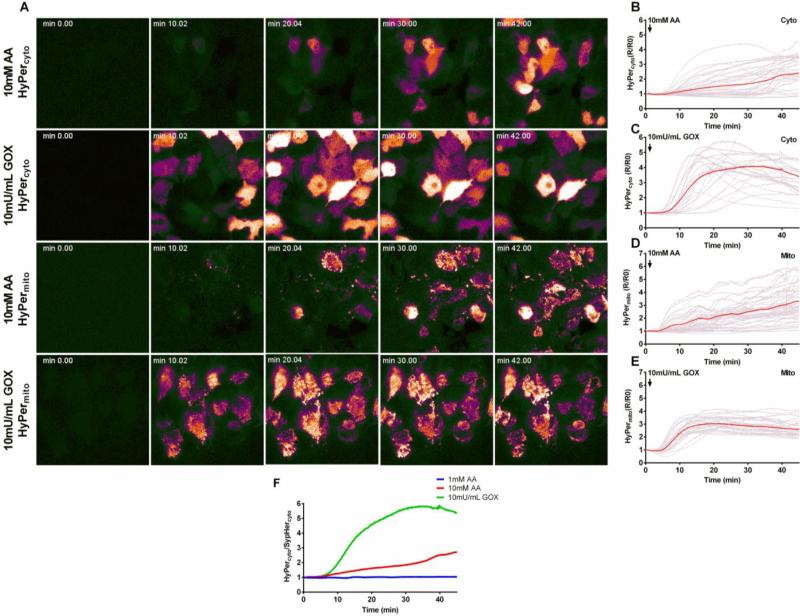
Figure 4. Intracellular H2O2 in the cytosol and mitochondrial matrix of Hep G2 cells after treatment with ascorbate or GOX using the genetically encoded sensor HyPer as a probe.
Hep G2 cells were transfected with HyPercyto or HyPermito as described in Materials and Methods. (A) Time course of HyPercyto and HyPermito fluorescence ratio after treatment with 10 mM ascorbate (first and third rows) or 10 mU/mL GOX (second and fourth rows). (B-C) Ratiometric fluorescent traces of individual cells expressing HyPercyto after treatment with 10 mM ascorbate (B) or 10 mU/mL GOX (C). Red traces represent average fluorescence intensity over all cells (D-E) Ratiometric fluorescence traces of individual cells expressing HyPermito after treatment with 10 mM ascorbate (D) or 10 mU/mL GOX (E). (F) Ratio of average HyPercyto to SypHercyto fluorescence signals after treatment with 1 mM ascorbate (blue), 10 mM ascorbate (red), or 10 mU/mL GOX (green). AA = ascorbate, GOX = glucose oxidase.

