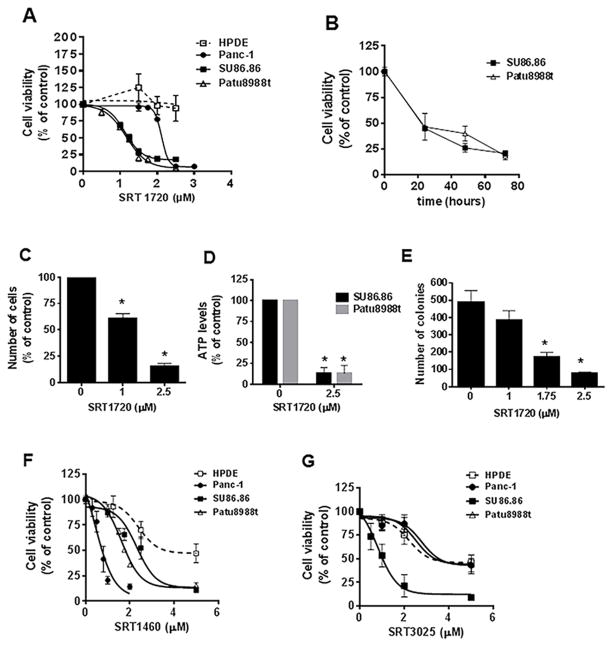
Figure 1. STACs decrease pancreatic cancer cell survival and growth.
A, Cells were treated with vehicle (control) or different concentrations of SRT1720 and submitted to MTT analysis 72 hours after treatment. IC50s (μM) were: Patu8988t, 1.2 ± 0.07; SU86.86, 1.13 ± 0.04; Panc-1, 2.1 ± 0.04. B, SU86.86 and Patu8988t cells were treated with vehicle or 2 μM SRT1720 for different time periods. Cells were submitted to MTT analysis. C, Patu8988t cells were treated with vehicle (control) or SRT1720 for 72 hours and cells were counted by Trypan blue dye exclusion assay. D, ATP levels were measured in pancreatic cancer cells after treatment with vehicle (control) or 2.5 μM SRT1720 for 48 hours. E, Patu8988t cells were grown in soft agar containing vehicle or different concentrations of SRT1720 for 7 days. Graph shows quantitative analysis of colony number. F, Cells were treated with vehicle or different concentrations of SRT1460 and submitted to MTT analysis 72 hours after treatment. IC50s (μM) were: Patu8988t, 1.62 ± 0.13; SU86.86, 2.31 ± 0.23; Panc-1, 0.66 ± 0.02; HPDE, 2.39 ± 0.29. G, Cells were treated with vehicle or different concentrations of SRT3025 for 72 hours and submitted to MTT analysis. SRT3025 IC50 (μM) for SU86.86 cells was 0.98 ± 0.13. Vehicle-treated cells (control) were assigned as 100 % cell viability. Values are mean ± SEM of at least three independent experiments.* indicates p<0.05, compared to vehicle.

