Fig. 1.
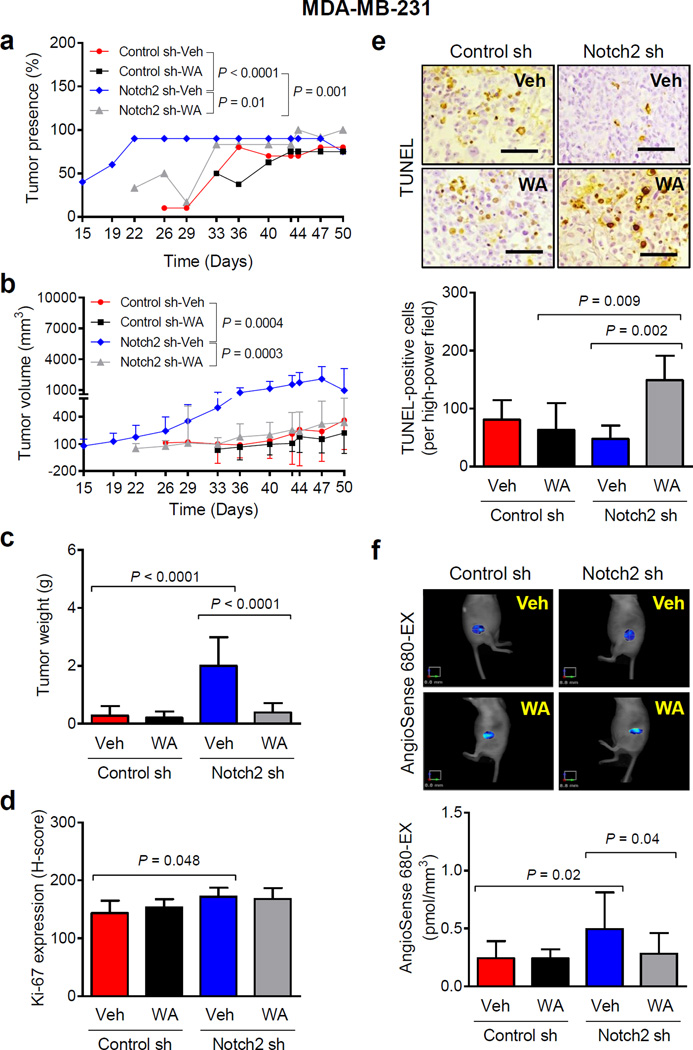
Knockdown of Notch2 accelerates in vivo growth of MDA-MB-231 xenografts. a Percentage of tumor presence over time in mice xenografted with MDA-MB-231 cells stably transfected with control shRNA (Control sh) or Notch2 shRNA (Notch2 sh) and treated with vehicle (Control sh-Veh or Notch2 sh-Veh) or 100 µg of withaferin A (WA)/mouse (Control sh-WA or Notch2 sh-WA) by intraperitoneal route. Results shown are percentage of tumor presence (n = 10 for Control sh-Veh; n = 8 for Control sh-WA; n = 10 for Notch2 sh-Veh except on day 50 where n = 4; n = 12 for Notch2 sh-WA). b Tumor volume over time for mice of different groups. Results shown are mean tumor volume with their 95% confidence intervals (error bars). c Wet tumor weight of MDA-MB-231 xenografts from different groups. Results shown are mean wet tumor weight with their 95% confidence intervals (error bars, n = 8 for Control sh-Veh; n = 6 for Control sh-WA; n = 9 for Notch2 sh-Veh; n = 12 for Notch2 sh-WA). d Immunohistochemical analysis of Ki-67 expression in MDA-MB-231 xenografts from different groups. Results shown are mean H-score with their 95% confidence intervals (error bars, n = 7 for Control sh-Veh; n = 6 for Control sh-WA; n = 6 for Notch2 sh-Veh; n = 9 for Notch2 sh-WA). e Representative images depicting TUNEL-positive (apoptotic) cells (×200 magnification, scale bar = 100 µm) and their quantitation in MDA-MB-231 xenografts of different groups. Results shown are mean TUNEL-positive cells with their 95% confidence intervals (error bars, n = 7 for Control sh-Veh; n = 6 for Control sh-WA; n = 6 for Notch2 sh-Veh; n = 9 for Notch2 sh-WA). f Representative images and quantitation of AngioSense 680-EX fluorescence in MDA-MB-231 xenograft bearing mice of different groups. Results shown are mean AngioSense 680-EX fluorescence with their 95% confidence intervals (error bars, n = 6 for Control sh-Veh; n = 5 for Control sh-WA; n = 3 for Notch2 sh-Veh; n = 5 for Notch2 sh-WA). Statistical significance of difference was analyzed by generalized linear mixed model and the least square means were used for comparison. The P values were adjusted using Holm-Sidak methods. All P values were two-sided and a significance level was set at 0.05.

