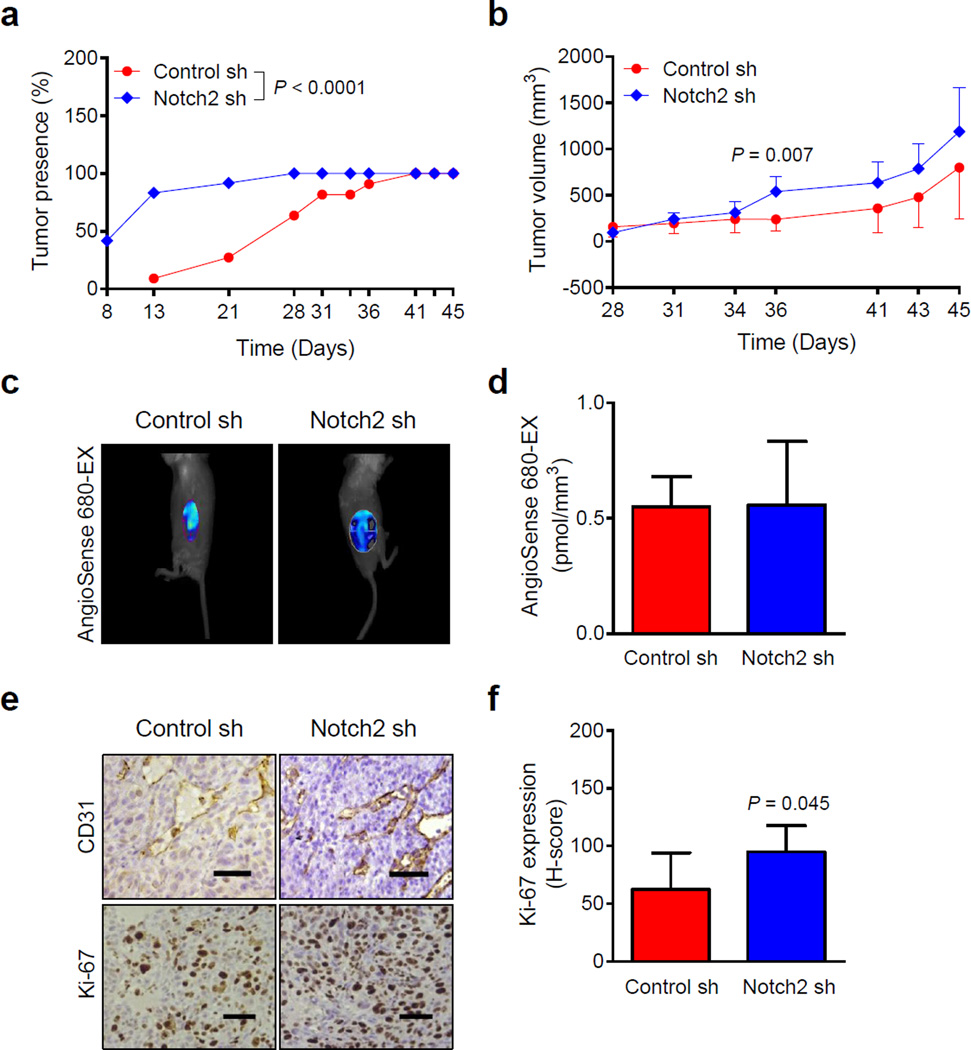
Fig. 2.
Notch2 knockdown augments in vivo growth of SUM159 xenografts in SCID mice. a Percentage of tumor presence as a function of time in mice bearing Control sh or Notch2 sh SUM159 cells. Results shown are percentage of tumor presence over time (n = 11 from 6 mice in Control sh group; n = 12 from 6 mice in Notch2 sh group). b Tumor volume over time for Control sh and Notch2 sh SUM159 xenografts. Results shown are mean tumor volume with their 95% confidence intervals (error bars). Representative images (c) and quantitation (d) of AngioSense 680-EX fluorescence for detection of angiogenesis in SUM159 xenografts. Results shown are mean AngioSense 680-EX fluorescence with their 95% confidence intervals (error bars, n = 6 for Control sh; n = 4 for Notch2 sh). e Representative images for CD31-positive blood vessels and immunohistochemical analysis of Ki-67 expression (×200 magnification, scale bar = 100 µm) in tumor sections of SUM159 Control sh and Notch2 sh groups. f Quantitation of Ki-67 expression in SUM159 xenograft sections. Results shown are mean H-score with their 95% confidence intervals (error bars, n = 5 for Control sh; n = 6 for Notch2 sh). Statistical significance of difference, except for data in panels b, d, and f in which unpaired Student t test was used, was analyzed by generalized linear mixed model and the least square means were used for comparison. All P values were two-sided and a significance level was set at 0.05.

