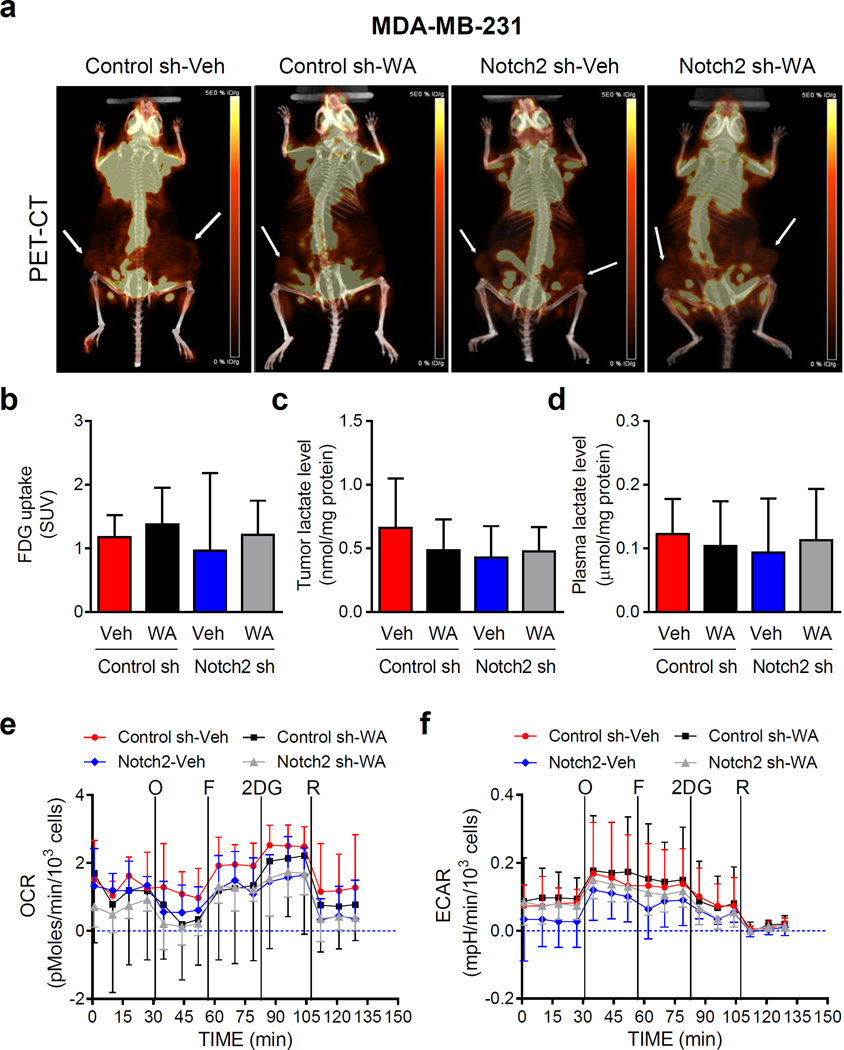
Fig. 4.
Knockdown of Notch2 has no appreciable effect on in vivo glycolysis or oxidative phosphorylation in MDA-MB-231 xenografts. a Representative images for positron emission tomography/computed tomography (PET/CT) for mice bearing MDA-MB-231 xenografts of different groups. Location of the tumor is indicated by an arrow. Quantitation of 18F-FDG uptake (b) and tumor lactate level (c) or plasma lactate level (d) from the MDA-MB-231 xenograft study. Results for PET/CT are shown as mean 18F-FDG uptake levels (SUV) with their 95% confidence intervals (error bars, n = 6 for Control sh-Veh; n = 5 for Control sh-WA; n = 2 for Notch2 sh-Veh; n = 6 for Notch2 sh-WA). Results for tumor or plasma lactate level are shown as mean lactate levels with their 95% confidence intervals (error bars, n = 3 for all four groups). Real-time measurement of ex vivo oxygen consumption rate (OCR) (e) and extracellular acidification rate (ECAR) (f) in MDA-MB-231 xenografts of different groups. O: 1 µM of oligomycin; F: 300 nM of FCCP; 2DG: 100 mM of 2-deoxyglucose; R: 1 µM of rotenone. Results shown are mean OCR and mean ECAR with their 95% confidence intervals (error bars, n = 4 for Control sh-Veh; n = 3 for Control sh-WA; n = 3 for Notch2 sh-Veh; n = 6 for Notch2 sh-WA). Statistical significance of difference was analyzed by generalized linear mixed model and the least square means were used for comparison. The P values were adjusted using Holm-Sidak methods. All P values were two-sided and a significance level was set at 0.05.

