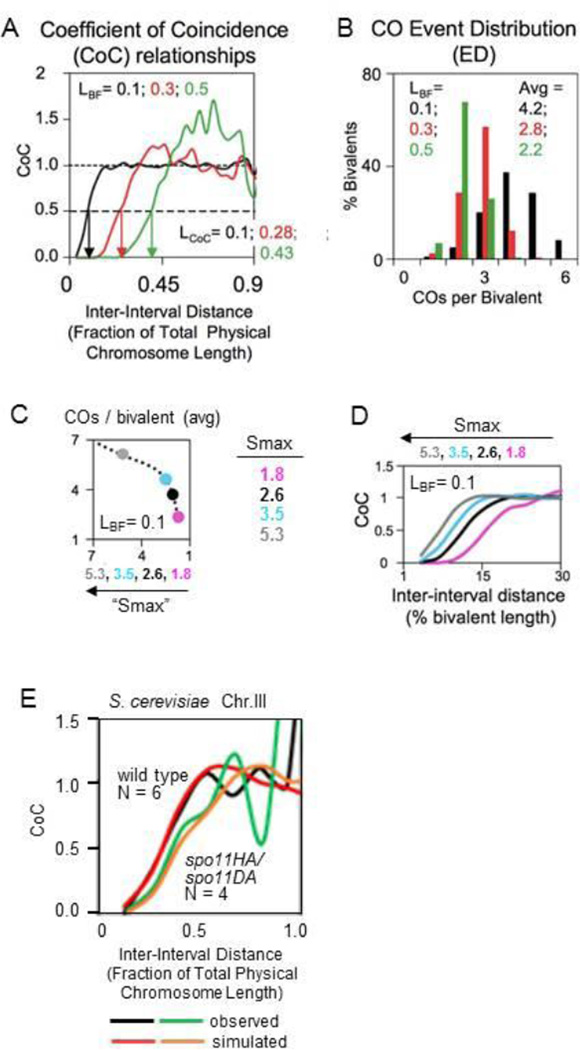
Figure 2. Coefficient of Coincidence (CoC) Analyses.
A, B. CoC relationships (A) and the density distribution of different numbers of COs per bivalent (B) from data sets created by simulations using the beam-film model under different values of relevant parameters. Among these, (L) or (LBF) denotes the distance over which the interference signal spreads. (LCoC) denotes the inter-interval distance at which CoC = 0.5. [reprinted from 75] C, D Beam-film simulations illustrate the fact that when the strength of CO-designation increases, the number of COs per bivalent increases (C) and the CoC curves shift to the left, even though there is no change in the distance over which the interference signal spreads [adapted from 77.]. In such simulations, the strength of CO-designation is given by parameter Smax and interference distance is given by parameter L. Simulation parameter values are defined relativistically. Smax can range from zero (i.e. no CO-designation) to non-zero values that give appropriate outcomes. In simulations of several experimental datasets, the values of Smax range from ~1 to ~3.5 (75). Parameter L is defined as a fraction of bivalent length. In the simulation shown, Smax is varied from 1.8 to 5.3 while L remains constant at L=0.1 (10% of bivalent length). E. Reduction in the average number of DSBs per chromosome resulting from a spo11 mutant condition shifts the CoC curve to the right as observed for S. cerevisiae chromosome III (compare black and green). Beam-film simulations under best-fit conditions for this organism demonstrate that this shift is attributable solely to a decrease in the number of DSB-mediated precursor interactions (N) from N=6 in the wild-type to N=4 in the mutant with no change in the spreading interference signal or any other feature of CO formation/patterning (data and rationale in 75; and 78). [Figure is by L. Zhang and N.K. unpublished].

