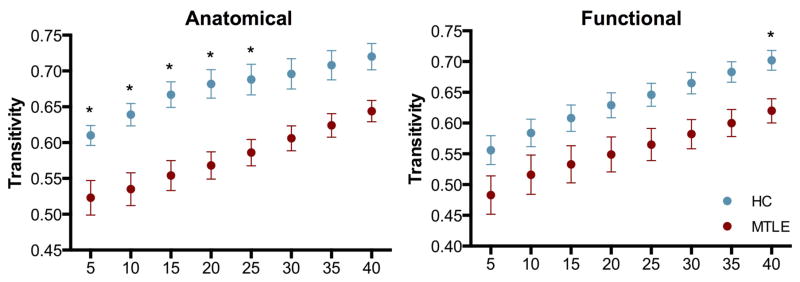
Figure 2. Global clustering.
Global clustering in the anatomically defined (left) and the functionally defined (right) graphs across a range of network densities between mTLE (red) and healthy subjects (blue). In both kinds of networks, patients show lower global clustering when compared to controls. * Significant at p<0.05, corrected for multiple comparisons.

