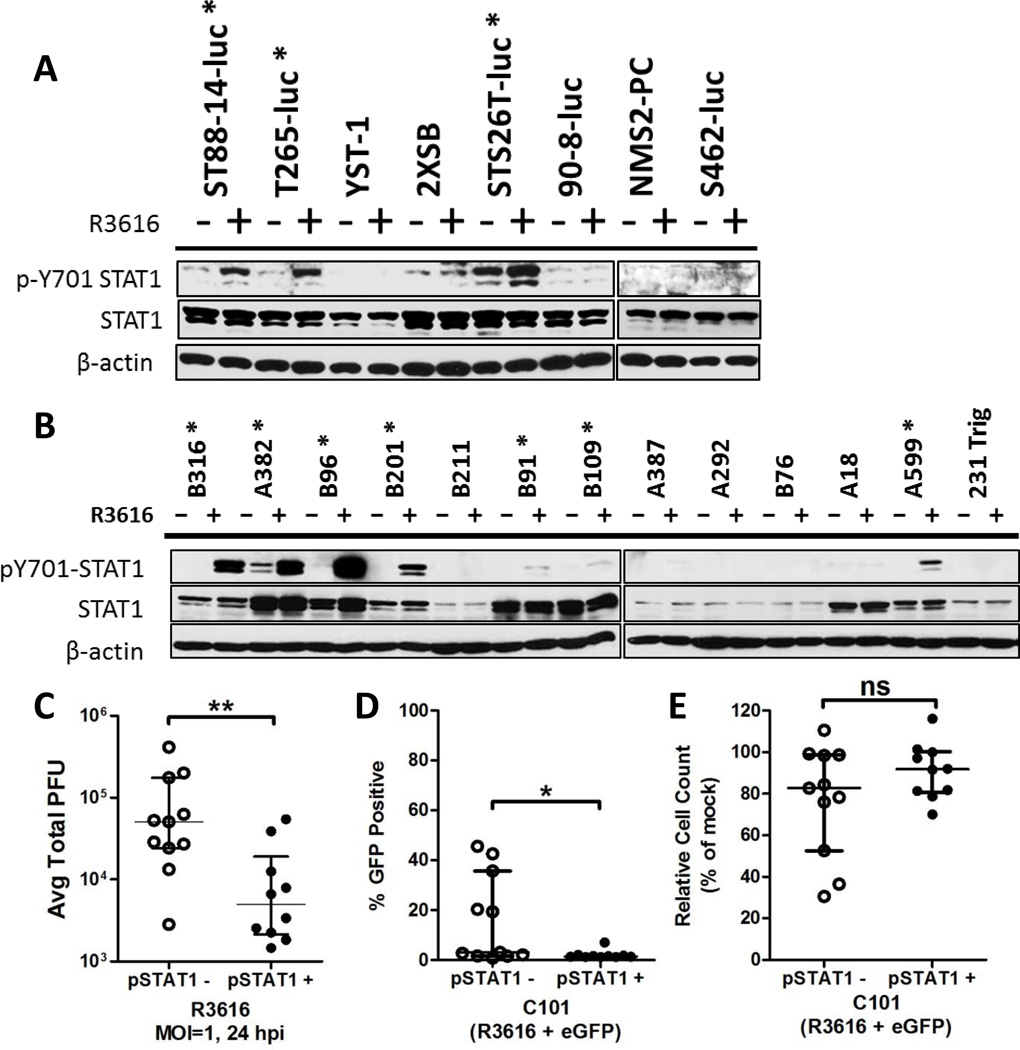
Figure 2. STAT1 response to oHSV infection and association with viral productivity.
STAT1 phosphorylation in response to R3616 infection (MOI=1, 6hpi) was assessed by western blot in human (A) and mouse (B) cell lines. Cell lines considered STAT1 responsive are marked with an asterisk. The mean viral titers (from Fig. 1 A–B) from each cell line were sorted into STAT1 unresponsive and responsive groups and tested for statistical significance using the Mann-Whitney U test with the median and interquartile range plotted (C). Cell lines were assessed in a multistep infection assay (MOI=0.1, 48 hpi) with C101 for the percentage of cells positive for GFP (D) and the infected cell count as a percentage of the mock infected cell count (E). Data were collected in triplicate and the mean reported. Cell lines were sorted based on their STAT1 response and tested for statistical significance using the Mann-Whitney U test with the medians and interquartile range plotted.

