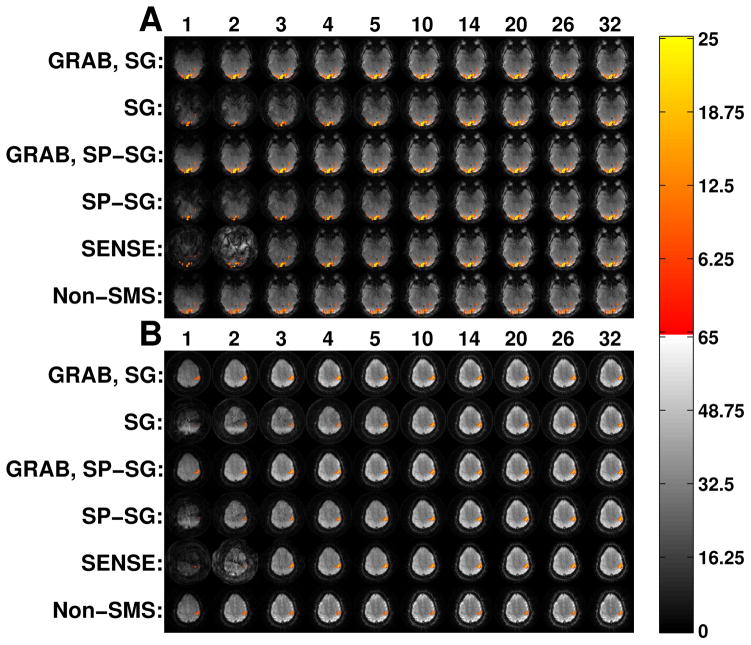
Figure 4.
(a) Visual and (b) motor cortex activation maps over reconstructed images for subject 5. The underlying background image is the actual result using the indicated reconstruction method. A t-score threshold of 6 was used for all methods. The top of each column lists the number of virtual coils for that column. For each of (a) and (b), the same visual or motor cortex slice is pictured for all methods and number of virtual coils. The activated voxel color scale is the t-score.

