Fig. 5.
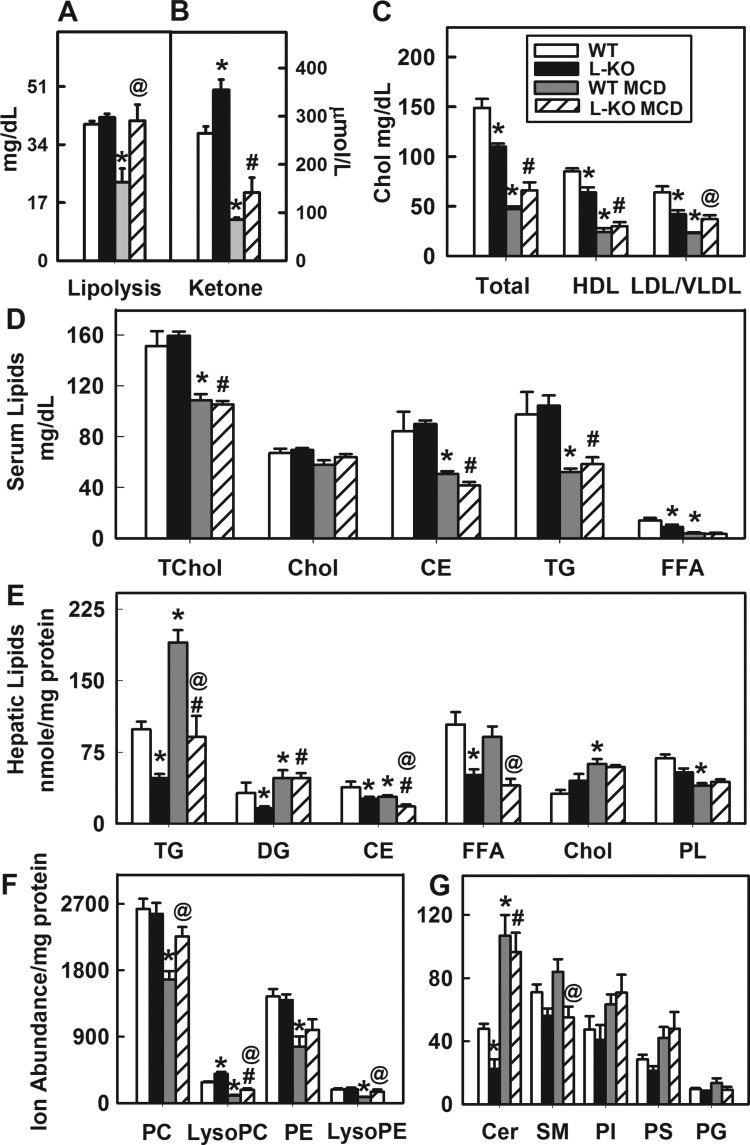
Hepatic Plin2 ablation and MCD diet alter lipid and lipoprotein profiles. A and B: lipolytic activity and ketone body levels in liver samples from WT and L-KO mice on control or MCD diets. C: serum lipoproteins levels. HDL, high-density lipoprotein; LDL, low-density lipoprotein; VLDL, very-low-density lipoprotein. D: serum lipid levels. TChol, total cholesterol; CE, cholesteryl esters; TG, triglyceride; FFA, free fatty acid. E: hepatic lipid levels. DG, diglyceride; PL, phospholipid. F and G: ion abundance of individual phospholipid classes with high and low abundance in liver. PC, phosphatidylcholine; PE, phosphatidylethanolamine; Cer, ceramide; SM, sphingomyelin; PI, phosphatidylinositol; PS, phosphatidylserine; PG, phosphatidylglycerol. Values represent means ± SE, n = 4–5. *P < 0.05 vs. WT mice on the control diet. @P < 0.05 vs. WT mice on the MCD diet. #P < 0.05 vs. L-KO mice on the control diet.

