Fig. 3.
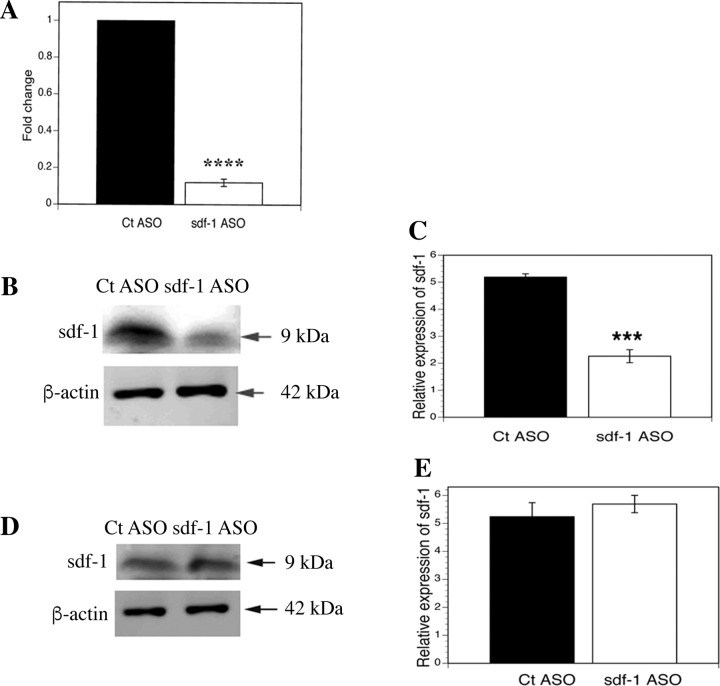
Selectivity of knockdown by sdf1 antisense oligonucleotide (ASO). A: sdf1 gene expression in liver after scrambled control (Ct) ASO and sdf1 ASO. B and C: sdf1 immunoblot and quantification of immunoblot in liver tissue after control and sdf1 ASO. D and E: sdf1 immunoblot and quantification of immunoblot in bone marrow (BM) after control and sdf1 ASO. Sdf1 ASO decreases hepatic sdf1 gene expression by 88% (****P < 0.0001) and sdf1 protein expression by 50% (***P < 0.0005) compared with scrambled ASO control but does not affect BM expression of sdf1 protein. Values are means ± SE (n = 3).

