Fig. 7.
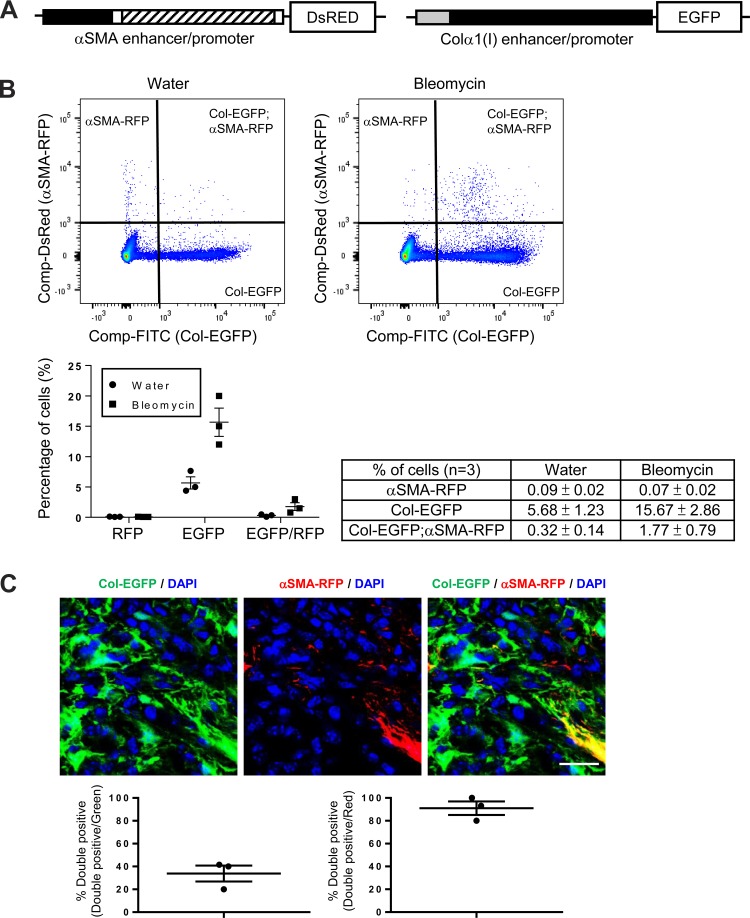
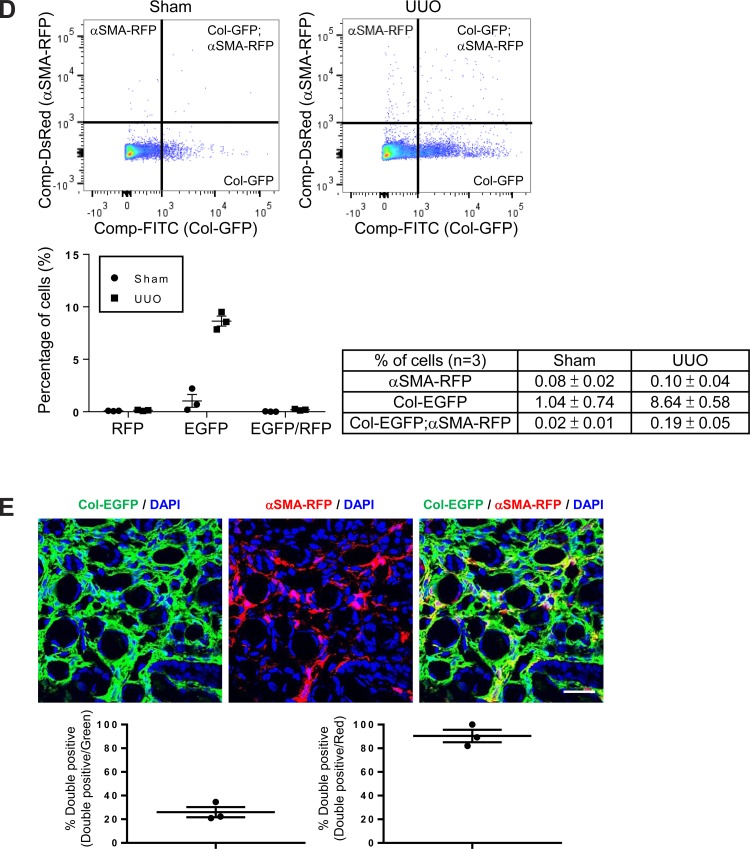
Only a minority of collagen-producing cells coexpress αSMA in the fibrotic lung and kidney. A: schematic of αSMA-RFP (30, 49) and Col-EGFP (30, 52) reporter mice. The αSMA enhancer/promoter construct consists ∼1-kb 5′-flanking region (black box), the transcription start site, the 48-bp exon 1 (white box), the ∼2.5-kb intron 1 (hatched box), and the 15-bp exon 2 (white box) (30, 49) from the mouse αSMA gene. The Colα1(I) enhancer/promoter contains an enhancer fragment, 5′-deoxyribonuclease (DNase) I-hypersensitive sites (HS) 4.5, followed by the ∼3-kb mouse Colα1(I) gene promoter (30, 52). B: flow cytometry–based quantification of cells isolated from the lungs of 14-day water- or bleomycin-treated Col-EGFP/αSMA-RFP mice. Data were collected from three mice. Representative dot plots are shown. Data are means ± SE. C: immunofluorescence micrographs and image quantification of lung sections from 14-day bleomycin-treated Col-EGFP/αSMA-RFP mice, costained with GFP and RFP antibodies to enhance the endogenous Col-EGFP and αSMA-RFP signals for microscopic imaging. Panel at left shows DAPI (blue) and Col-GFP (green), panel in middle shows DAPI (blue) and αSMA-RFP (red), and panel at right shows the merged image. Scale bar, 50 μm. D: flow cytometry-based quantification of cells isolated from the kidneys of 7-day sham- or UUO-treated Col-EGFP/αSMA-RFP mice. Data were collected from three mice. Representative dot plots are shown. Data are means ± SE. E: immunofluorescence micrographs and image quantification of kidney sections from 7-day UUO-treated Col-EGFP/αSMA-RFP mice, costained with GFP and RFP antibodies as above. Panel at left shows DAPI (blue) and Col-EGFP (green), panel in middle shows DAPI (blue) and αSMA-RFP (red), and panel at right shows the merged image. Scale bar, 50 μm.


