
Fig. 2.
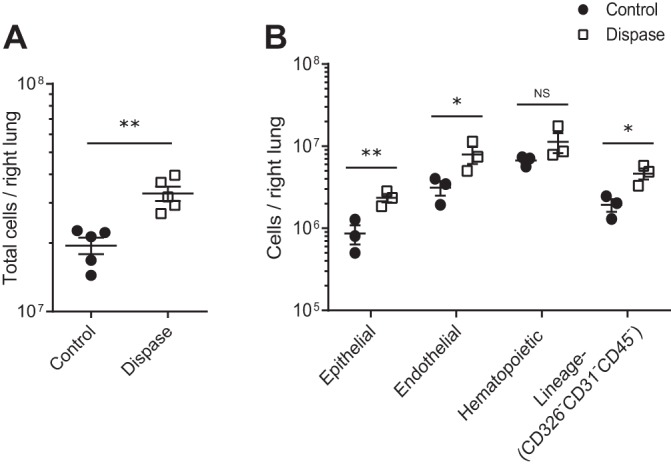
Total cellular yields and yields of epithelial (CD326+CD31−CD45−), endothelial (CD326−CD31+CD45−), hematopoietic lineage (CD326−CD31−CD45+), and lineage-negative (CD326−CD31−CD45−) cells per right lung after control and Dispase dissociation methods. A: total cellular yield per right lung is shown on a log scale; n = 5 per group. B: compartment cellular yields within each population including the lineage-negative (CD326−CD31−CD45−) population are shown on a log scale; ANOVA P < 0.0001 for control vs. Dispase using log-transformed data; n = 3 per group. *P < 0.05, **P < 0.01. NS, not significant. Values reported are means ± SE.