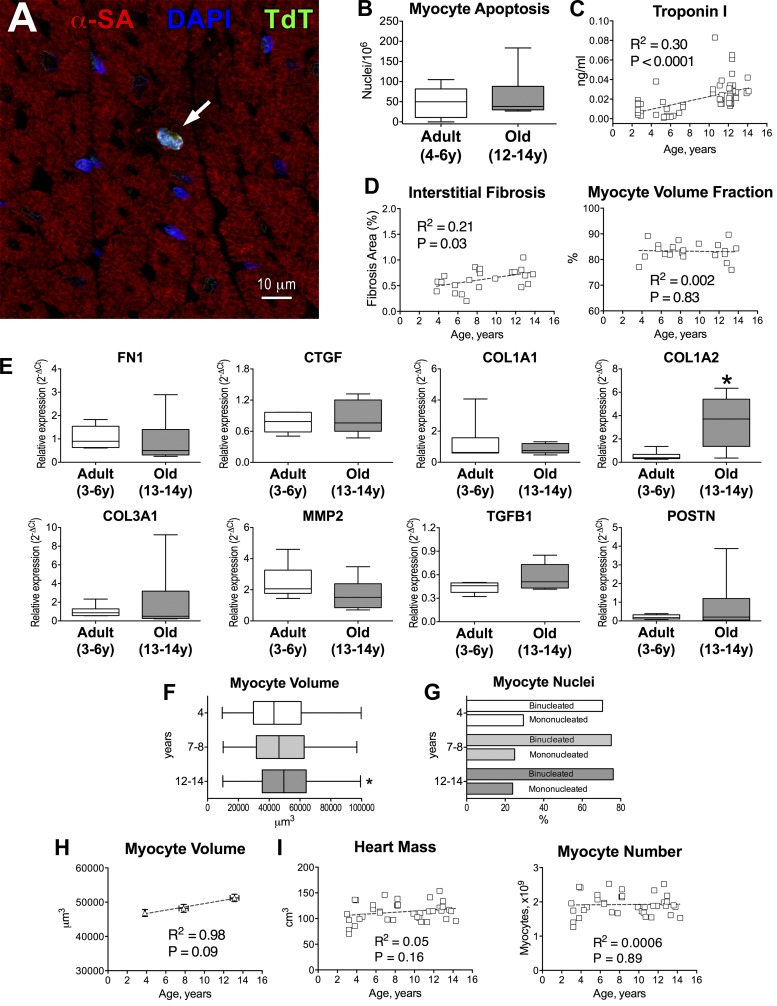
Fig. 3.
Structural properties of the myocardium are modestly affected by aging in beagle dogs. A: apoptotic myocyte (arrow) in the adult canine myocardium by terminal deoxynucleotidyl transferase-mediated dUTP nick-end labeling (TUNEL; TdT; green) assay. Myocytes are identified by α-sarcomeric actin (α-SA; red). Nuclei are stained by DAPI (blue). B: quantitative data for myocyte apoptosis in the LV myocardium of adult (n = 5, 4.8 ± 0.4 yr) and old (n = 6, 12.9 ± 0.3 yr) beagle dogs are shown as median and interquartile ranges. C: circulating levels of cardiac troponin I in beagle dogs (n = 63). Data are fitted with linear regression. R2 and P values are reported. D: quantitative measurements of interstitial fibrosis (n = 23) and volume fraction (n = 22) of cardiomyocytes. Data are fitted with linear regression. R2 and P values for each fitting are reported. E: quantitative data for level of transcript for fibronectin (FN1), connective tissue growth factor (CTGF), collagen type I α1 (COL1A1), collagen type I α2 (COL1A2), collagen type III α1 (COL3A1), matrix metalloproteinase-II (MMP2), transforming growth factor-β1 (TGFB1), and periostin (POSTN) in the LV of adult and old beagle dogs. Data are shown as median and interquartile ranges (adult: n = 6 specimens, 6 dogs, 4.4 ± 0.4 yr; old: n = 6 specimens, 6 dogs, 13.1 ± 0.2 yr). *P < 0.05 vs. adult. F: volume of cardiomyocytes obtained from beagle dogs at 4, 7–8 and 12–14 yr of age (n = 404 myocytes, 3 dogs, 3.8 ± 0.03 yr; n = 309 myocytes, 4 dogs, 7.9 ± 0.2 yr; n = 360 myocytes, 4 dogs, 13.1 ± 0.2 yr, respectively) is shown as median and interquartile ranges. *P < 0.01 vs. 4 yr. G: fraction of mononucleated and binucleated myocytes for cells shown in F. H: quantitative data for myocyte volume shown in F are reported as mean ± SE and fitted with linear regression. R2 and P values are reported. I: myocardial mass and computed myocyte number in aging beagle dogs (n = 38). Data are fitted with linear regression. R2 and P values for each fitting are reported.

