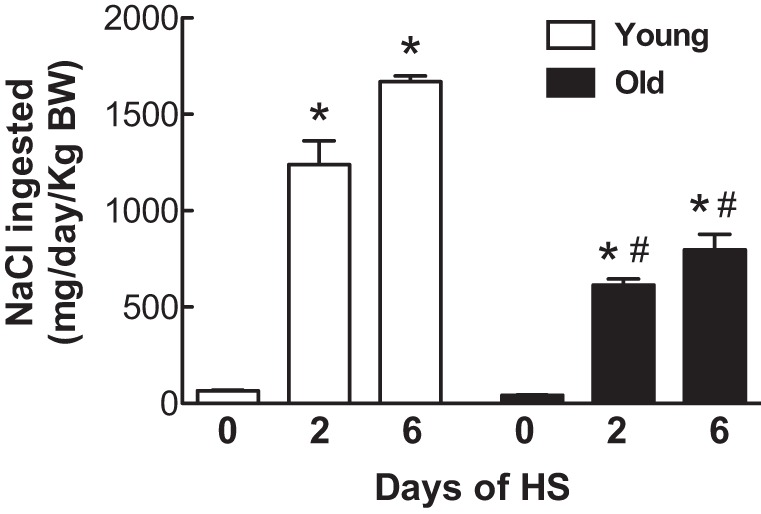
Fig. 3.

Effect of age on dietary sodium intake in response to a HS diet. Dietary sodium intake was normalized to body weight, and the results are expressed as means ± SE on days 0, 2, and 6 after the onset of a HS diet; *P < 0.05 vs. day 0 within the same age groups; #P < 0.05 vs. young rats on the same day; n = 6/group.
