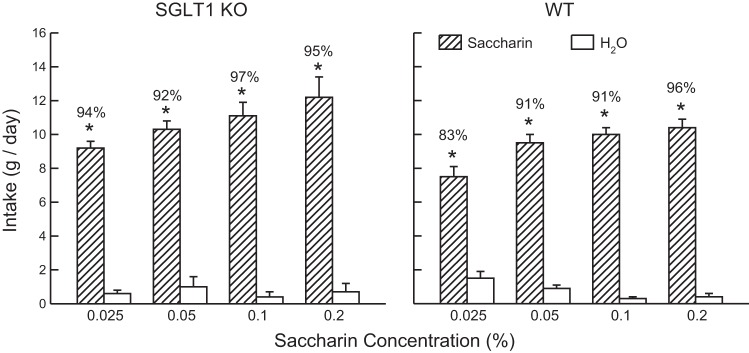
Fig. 1.
Experiment 1. Mean (+SE) intakes of saccharin solution and water in two-bottle tests at sweetener concentrations of 0.025 to 0.2%. Left: Sodium-glucose transporters (SGLT1) knockout (KO) data. Right: B6 wild-type (WT) data. Numbers atop bars represent mean percent preference for saccharin. Significant intake differences (*P < 0.05) are indicated within each test.

