
Fig. 4.
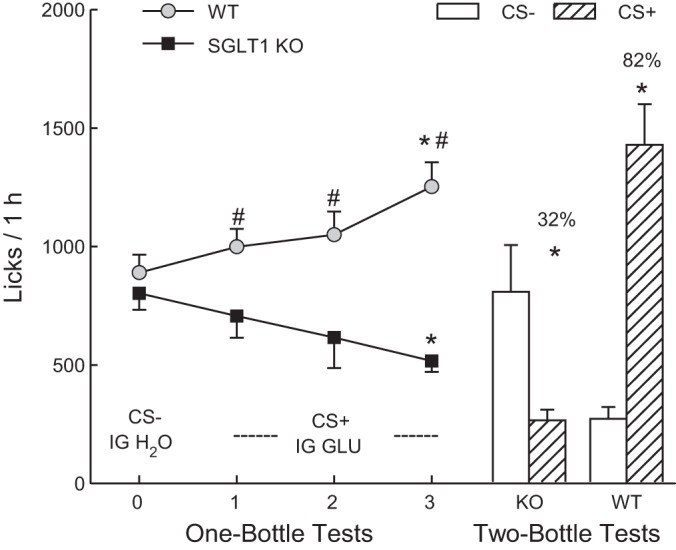
Experiment 3. Mean licks (+SE) during one-bottle tests 0–3 (left curves) and two-bottle tests (right bars) conducted with SGLT1 KO and WT mice. In test 0, the mice drank (1 h/day) a CS−-flavored solution paired with IG self-infusions of water, and in tests 1–3, they drank a CS+-flavored solution paired with IG self-infusions of 8% glucose. In the two-bottle preference test, the mice drank the CS+ and CS− solutions not paired with IG infusions. Significant within-group differences (*P < 0.05) between CS+ and CS- licks are indicated. Significant between-group differences (#P < 0.05) in CS+ licks are indicated.