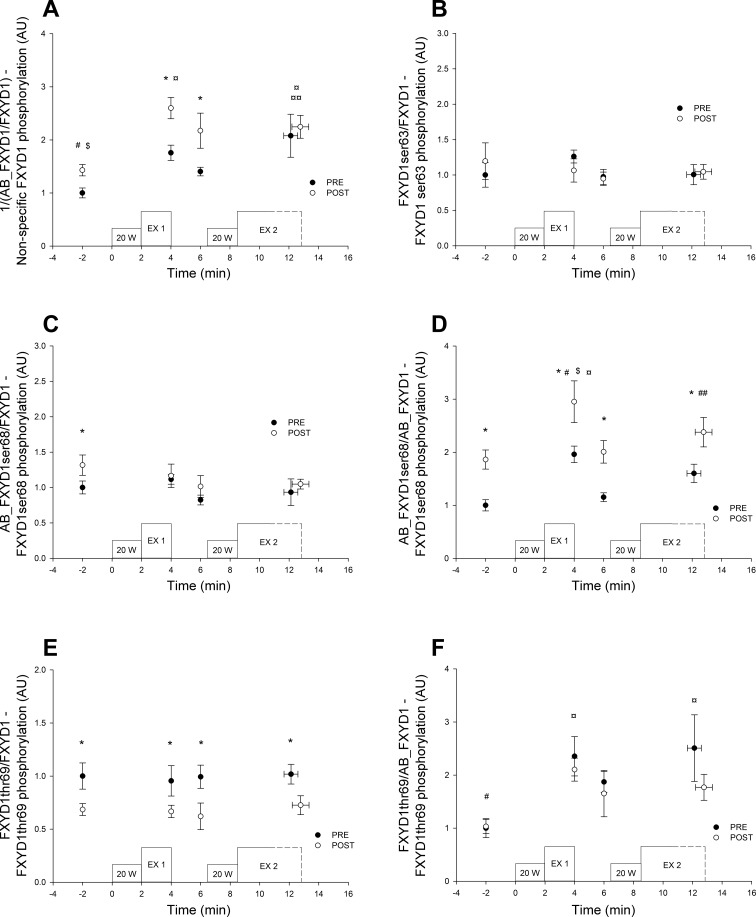
Fig. 3.
Muscle FXYD1 phosphorylation at rest and during repeated intense exercise (EX1 and EX2) before (PRE) and after (POST) 7 wk of high-intensity training in combination with a reduced training volume (IT) in trained cyclist (n = 7). Data are normalized to the mean at rest before the intervention period (PRE) and expressed as means ± SE. A: nonspecific FXYD1 phosphorylation. For overall statistical effects: Acute exercise: P > 0.001; Training: P = 0.012, and Interaction: P = 0.232. *Post higher than Pre. #Rest lower than all other time points. $Rest lower than all other time points after IT (Post). ¤End of EX1 and EX2 higher than rest before IT (PRE) and ¤¤ End of EX2 higher than before EX2 before IT (PRE). B: FXYD1 Ser-63 phosphorylation For overall statistical effects: Acute exercise: P = 0.359; Training: P = 0.938; and Interaction: P = 0.165. C: FXYD1 Ser-68 phosphorylation. For overall statistical effects: Acute exercise: P = 0.053, Training: P = 0.046, and Interaction: P = 0.520. *Post higher than Pre. D: FXYD1 Ser-68 phosphorylation, considering antibody phospho-sensitivity, For overall statistical effects: Acute exercise: P < 0.001, Training: P = 0.004, and Interaction: P = 0.920. *Post higher than Pre. #End of EX1 higher than all other time points. ##End of EX2 higher than Rest and before EX2. $End of EX1 higher than all other time points after IT (Post). ¤End of EX1 higher than Rest and before EX2 before IT (PRE). E: FXYD1 Thr-69 phosphorylation For overall statistical effects: Acute exercise: P = 0.824, Training: P = 0.001, and Interaction: P = 0.937. *POST lower than PRE. F: FXYD1 Thr-69 phosphorylation, considering antibody phospho-sensitivity For overall statistical effects: Acute exercise: P = 0.006; Training: P = 0.071; and Interaction: P = 0.723. #Rest lower than all other time points. ¤End of EX1 and End of EX2 higher than Rest before IT (Pre).

