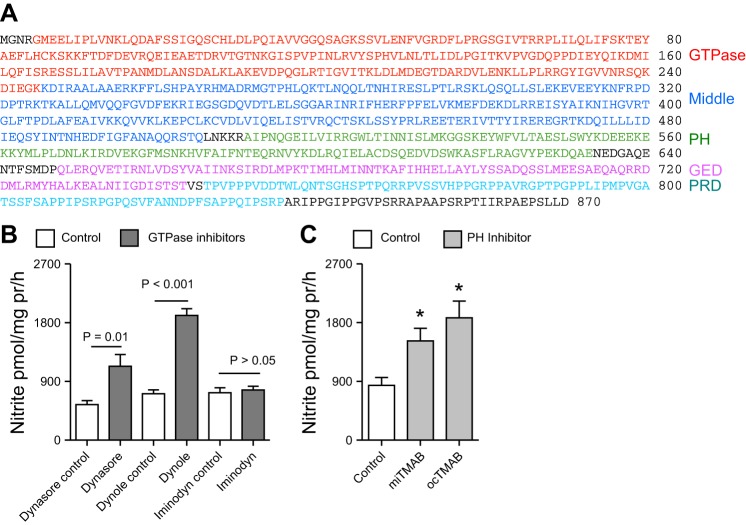
Fig. 4.
The domains of DNM2 and pharmacological inhibition of DNM2. A: illustration of the different domains in mouse DNM2. PH, plekstrin homology; GED, GTPase effector domain; PRD, proline-rich domain; B: acute pharmacological blockade of the GTPase domain of DNM2 with a panel of inhibitors, resulted in a significant increase in mIMCD-3 nitrite production, compared with their respective controls. C: acute pharmacological inhibition of the PH domain of DNM2 resulted in a significant increase in mIMCD-3 nitrite production, compared with control (P = 0.01). Two-factor ANOVA with Sidak's multiple (6) comparisons were used. *Significant difference compared with control.

