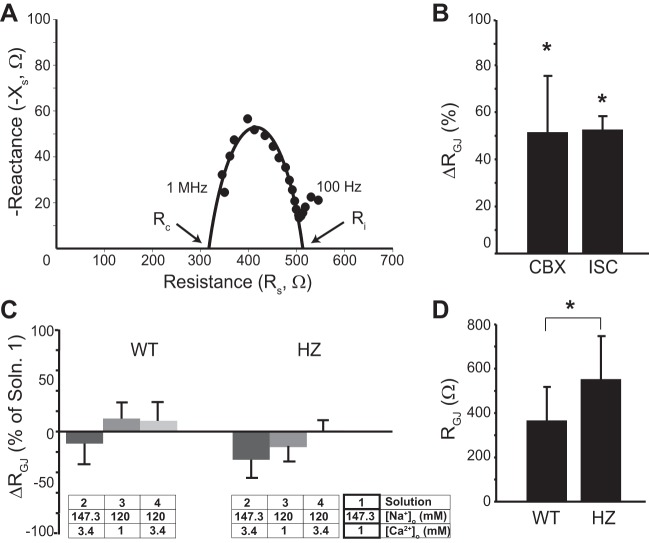
Fig. 6.
Tissue impedance during variation in [Na+]o and [Ca2+]o. A: representative resistance (Rs)-reactance (Xs) curve with circle fit. B: percent change (Δ) in gap junctional resistance (RGJ) increases after treatment with 50 μM carbenoxolone (CBX) and 30 min of ischemia (ISC). C: average RGJ values determined during perfusion of solutions with different [Na+]o and [Ca2+]o. D: RGJ resistance is significantly increased in HZ hearts relative to WT. Values are means ± SD. *P < 0.05 by paired Student's t-test in B and C, and unpaired Student's t-test in D.

